Pandas - DataFrame
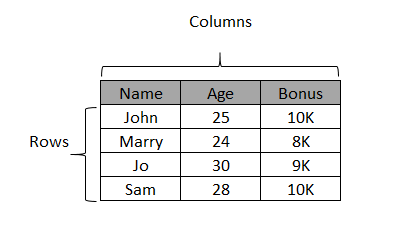
Pandas DataFrame is a two-dimensional data structure with labeled axes (rows and columns). It is used to store data that has two different indexes: row index and column index. The DataFrame can potentially contain heterogeneous tabular data.
The structure of the DataFrame can be depicted using table below:
Create DataFrame
A Pandas DataFrame can be created using DataFrame() constructor. The syntax for using the function is given below:
Syntax
pandas.DataFrame(data, index, columns, dtype, copy)
Parameters
data |
Optional. Specify data. It takes data in various forms like ndarray, series, map, lists, dict, constants and also another DataFrame. |
index |
Optional. Specify the row labels. The Default np.arrange(n) index is used for row labels if no index is passed. |
columns |
Optional. Specify the column labels. The Default np.arrange(n) index is used for column labels if no column labels is passed. |
dtype |
Optional. Specify data type of each column. |
copy |
Optional. Specify True to copy data from inputs, False otherwise. Default is False. |
Create an empty DataFrame
An empty DataFrame can be created by passing no arguments in the DataFrame() constructor as shown below:
Example:
import pandas as pd
info = pd.DataFrame()

print(info)
The output of the above code will be:
Empty DataFrame
Columns: []
Index: []
Create a DataFrame from Lists
In the example below, a list called MyList is used to create a DataFrame. As the column labels are not provided, therefore by default np.arrange(n) is used for column labels.
Example:
import pandas as pd
MyList = ['John', 'Marry', 'Jo', 'Sam']
info = pd.DataFrame(MyList)

print(info)
The output of the above code will be:
       0
0   John
1  Marry
2     Jo
3    Sam
Example:
In the example below, a list of lists is used to create a DataFrame. Here, the column labels are also provided. Please note that due to dtype provided as float, value of 'Age' column is converted into float.
import pandas as pd
MyList = [['John', 25], ['Marry', 24], ['Jo', 30], ['Sam', 28]]
info = pd.DataFrame(MyList, columns=['Name', 'Age'], dtype=float)

print(info)
The output of the above code will be:
    Name   Age
0   John  25.0
1  Marry  24.0
2     Jo  30.0
3    Sam  28.0
Create a DataFrame from Dict of ndarrays / Lists
All the ndarrays/ Lists must have the same length. In the example below, as the row labels (index) are not provided, therefore by default np.arrange(n) is used for row labels.
Example:
import pandas as pd
data = {'Name': ['John', 'Marry', 'Jo', 'Sam'],
        'Age': [25, 24, 30, 28]}
info = pd.DataFrame(data)

print(info)
The output of the above code will be:
    Name  Age
0   John   25
1  Marry   24
2     Jo   30
3    Sam   28
Example:
The row labels of the DataFrame can be provided using index parameter as shown in the example below:
import pandas as pd
data = {'Name': ['John', 'Marry', 'Jo', 'Sam'],
        'Age': [25, 24, 30, 28]}
info = pd.DataFrame(data, index=['P1', 'P2', 'P3', 'P4'])

print(info)
The output of the above code will be:
     Name  Age
P1   John   25
P2  Marry   24
P3     Jo   30
P4    Sam   28
Create a DataFrame from List of Dicts
A list of dicts can also be used to create a DataFrame. The keys of the dictionaries will be taken as column labels as shown in the example below. Please note that, NaN is appended for the missing data.
Example:
import pandas as pd
data = [{'Name': 'John', 'Age': 25},
        {'Name': 'Marry', 'Age': 24},
        {'Name': 'Jo'}]
info = pd.DataFrame(data)

print(info)
The output of the above code will be:
    Name   Age
0   John  25.0
1  Marry  24.0
2     Jo   NaN
Example:
If the column label is provided different from dictionary key, the value NaN will be appended. In the example below column label Name1 is provided which is not matching with keys of the dictionary. Hence, this column contains NaN.
import pandas as pd
data = [{'Name': 'John', 'Age': 25},
        {'Name': 'Marry', 'Age': 24}]
info = pd.DataFrame(data, columns=['Name1', 'Age'])

print(info)
The output of the above code will be:
   Name1  Age
0    NaN   25
1    NaN   24
Create a DataFrame from Dict of Series
A dictionary of series can be used to form a DataFrame as shown in the example below:
Example:
import pandas as pd
data = { 'Name': pd.Series(['John', 'Marry']),
         'Age' : pd.Series([25, 24])}

info = pd.DataFrame(data)

print(info)
The output of the above code will be:
    Name  Age
0   John   25
1  Marry   24
The DataFrame provides functions for data manipulation, such as selection, addition, and deletion of columns and rows of a DataFrame. Let's discuss all these concepts one by one.
Column Selection
The example below describes how to access 'Name' column of the given DataFrame.
Example:
import pandas as pd
data = {"Name": ["John", "Mary", "Jo", "Sam"],
        "Age": [25, 24, 30, 28],
        "Salary": [60, 65, 68, 72]}
info = pd.DataFrame(data)

#access only 'Name' column
print(info['Name'])
The output of the above code will be:
0    John
1    Mary
2      Jo
3     Sam
Name: Name, dtype: object
Column Addition
The example below describes how to add a new column 'Bonus' in the DataFrame. Later on a new column 'Total' is also created which is the sum of two columns - 'Salary' and 'Bonus'.
Example:
import pandas as pd
data = {"Name": ["John", "Mary", "Jo", "Sam"],
        "Age": [25, 24, 30, 28],
        "Salary": [60, 65, 68, 72]}
info = pd.DataFrame(data)
print(info)

print()
#adding new column using panda series
info['Bonus'] = pd.Series([10, 8, 9, 10])
print("After adding a new column - Bonus")
print(info)

print()
#create a new column using existing columns
info['Total'] = info['Salary'] + info['Bonus']
print("After adding a new column - Total")
print(info)
The output of the above code will be:
   Name  Age  Salary
0  John   25      60
1  Mary   24      65
2    Jo   30      68
3   Sam   28      72

After adding a new column - Bonus
   Name  Age  Salary  Bonus
0  John   25      60     10
1  Mary   24      65      8
2    Jo   30      68      9
3   Sam   28      72     10

After adding a new column - Total
   Name  Age  Salary  Bonus  Total
0  John   25      60     10     70
1  Mary   24      65      8     73
2    Jo   30      68      9     77
3   Sam   28      72     10     82
Column Deletion
The example below describes how to delete columns from the given DataFrame.
Example:
import pandas as pd
data = {"Name": ["John", "Mary", "Jo", "Sam"],
        "Age": [25, 24, 30, 28],
        "Salary": [60, 65, 68, 72],
        "Bonus": [10, 8, 9, 10]}
info = pd.DataFrame(data)
print(info)

print()
#deleting Bonus column using del function
del info['Bonus']
print("After deleting Bonus column")
print(info)

print()
#deleting Salary column using pop function
info.pop('Salary')
print("After deleting Salary column")
print(info)
The output of the above code will be:
   Name  Age  Salary  Bonus
0  John   25      60     10
1  Mary   24      65      8
2    Jo   30      68      9
3   Sam   28      72     10

After deleting Bonus column
   Name  Age  Salary
0  John   25      60
1  Mary   24      65
2    Jo   30      68
3   Sam   28      72

After deleting Salary column
   Name  Age
0  John   25
1  Mary   24
2    Jo   30
3   Sam   28
Row Selection
The example below describes how to access rows of a given DataFrame.
Example: Selection by Label
It can be achieved by using loc function.
import pandas as pd
data = {"Name": ["John", "Mary", "Jo", "Sam"],
        "Age": [25, 24, 30, 28],
        "Salary": [60, 65, 68, 72]}
info = pd.DataFrame(data, index=['P1', 'P2', 'P3', 'P4'])

#select row by label
print(info.loc['P2'])
The output of the above code will be:
Name      Mary
Age         24
Salary      65
Name: P2, dtype: object
Example: Selection by integer location
It can be achieved by using iloc function.
import pandas as pd
data = {"Name": ["John", "Mary", "Jo", "Sam"],
        "Age": [25, 24, 30, 28],
        "Salary": [60, 65, 68, 72]}
info = pd.DataFrame(data, index=['P1', 'P2', 'P3', 'P4'])

#select row by integer location
print(info.iloc[1])
The output of the above code will be:
Name      Mary
Age         24
Salary      65
Name: P2, dtype: object
Example: Slice Rows
It can be done by using : operator.
import pandas as pd
data = {"Name": ["John", "Mary", "Jo", "Sam"],
        "Age": [25, 24, 30, 28],
        "Salary": [60, 65, 68, 72]}
info = pd.DataFrame(data, index=['P1', 'P2', 'P3', 'P4'])

#slice rows
print(info[1:3])
The output of the above code will be:
    Name  Age  Salary
P2  Mary   24      65
P3    Jo   30      68
Row Addition
To add a new row in the given DataFrame, append() function can be used as shown in the example below:
Example:
import pandas as pd
data = {"Name": ["John", "Mary"],
        "Age": [25, 24],
        "Salary": [60, 65]}
info = pd.DataFrame(data)
print(info)

print()
#adding a new row
new = pd.DataFrame([['Jo', 30, 68]], columns=['Name', 'Age', 'Salary'])
info = info.append(new)
print("After adding a new row")
print(info)
The output of the above code will be:
   Name  Age  Salary
0  John   25      60
1  Mary   24      65

After adding a new row
   Name  Age  Salary
0  John   25      60
1  Mary   24      65
0    Jo   30      68
Row Deletion
A row can be dropped using drop() function.
Example:
import pandas as pd
data = {"Name": ["John", "Mary", "Jo", "Sam"],
        "Age": [25, 24, 30, 28],
        "Salary": [60, 65, 68, 72],
        "Bonus": [10, 8, 9, 10]}
info = pd.DataFrame(data)
print(info)

print()
#deleting row by index label
info = info.drop(1)
print("After deleting row with label = 1")
print(info)
The output of the above code will be:
   Name  Age  Salary  Bonus
0  John   25      60     10
1  Mary   24      65      8
2    Jo   30      68      9
3   Sam   28      72     10

After deleting row with label = 1
   Name  Age  Salary  Bonus
0  John   25      60     10
2    Jo   30      68      9
3   Sam   28      72     10
