Seaborn - Tutorial

Seaborn is an open source, BSD-licensed Python data visualization library based on matplotlib. It provides a high-level interface for drawing attractive and informative statistical graphics.
About Tutorial
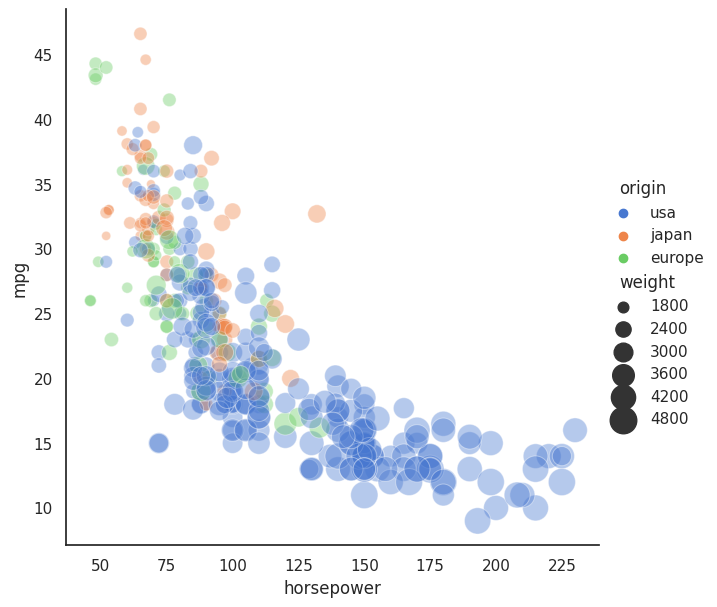
This tutorial is intended to take you through basics and various functions of Seaborn. It is specifically useful for people working on data analysis. Along with this, almost all examples can be executed online which provides better understanding of the package and helps you to learn it faster. An example of scatter bubble plot is drawn below for the illustration purpose:
import matplotlib.pyplot as plt
import seaborn as sns
sns.set_theme(style="white")

# Load the example mpg dataset
mpg = sns.load_dataset("mpg", data_home=".")

# Plot miles per gallon against horsepower
#with other semantics
sns.relplot(x="horsepower", y="mpg", hue="origin",
            size="weight", sizes=(40, 400), alpha=.4,
            palette="muted", height=6, data=mpg)

plt.show()
The output of the above code will be:
Prerequisite
A prior exposure of Python programming language would be an added advantage while following this tutorial. Seaborn library is a Python data visualization library based on Matplotlib. Therefore, it is recommended to go through the Matplotlib Tutorial before following this tutorial.
