Pandas DataFrame - plot.box() function
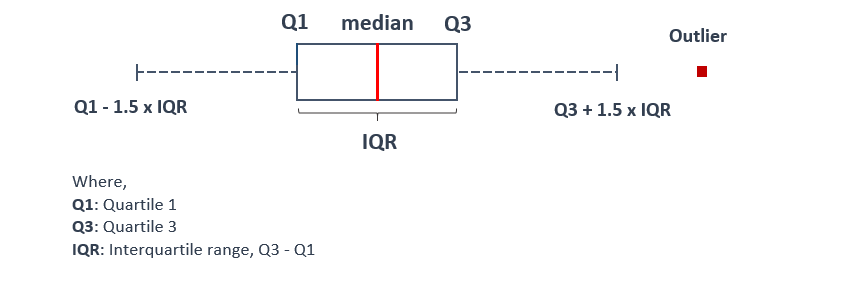
A box plot also known as a whisker plot is a method for graphically describing groups of numerical data through their quartiles. The box is drawn from first quartile (Q1) to third quartile (Q3) , indicating position of the median in the dataset. The whiskers extend from the box to show the range of the data.
The DataFrame.plot.box() functions makes makes a box and whisker plot of the DataFrame columns.
Syntax
DataFrame.plot.box(by=None)
Parameters
by |
Optional. Specify columns in the DataFrame to group by as str or sequence. |
Return Value
Returns matplotlib.axes.Axes or numpy.ndarray of them.
Example: box plot example
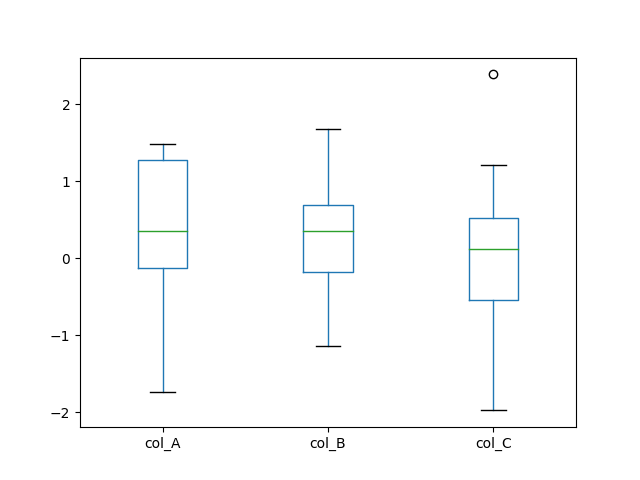
In the example below, a DataFrame df is created. A box plot of is created based on the data of df.
import pandas as pd
import numpy as np
import matplotlib.pyplot as plt

#providing seed for reproducibility
#of the result
np.random.seed(10)

df = pd.DataFrame(np.random.randn(10, 3),
  index = pd.date_range('1/1/2018', periods=10),
  columns = ['col_A', 'col_B', 'col_C']
)

#displaying the DataFrame
print(df,"\n")
#creating the plot
df.plot.box()

#displaying the plot
plt.show()
The output of the above code will be:
               col_A     col_B     col_C
2018-01-01  1.331587  0.715279 -1.545400
2018-01-02 -0.008384  0.621336 -0.720086
2018-01-03  0.265512  0.108549  0.004291
2018-01-04 -0.174600  0.433026  1.203037
2018-01-05 -0.965066  1.028274  0.228630
2018-01-06  0.445138 -1.136602  0.135137
2018-01-07  1.484537 -1.079805 -1.977728
2018-01-08 -1.743372  0.266070  2.384967
2018-01-09  1.123691  1.672622  0.099149
2018-01-10  1.397996 -0.271248  0.613204
❮ Pandas DataFrame - Functions
