Pandas DataFrame - plot.hist() function
A histogram is a graphical representation of the distribution of numerical data. To construct a histogram, the steps are given below:
- Bin (or bucket) the range of values.
- Divide the entire range of values into a series of intervals.
- Count how many values fall into each interval.
The bins are usually specified as consecutive, non-overlapping intervals of a variable. The bins (intervals) must be adjacent and are often (but not required to be) of equal size.
The DataFrame.plot.hist() functions groups the values of all given Series in the DataFrame into bins and draws all bins in one matplotlib.axes.Axes. This is useful when the DataFrame's Series are in a similar scale.
Syntax
DataFrame.plot.hist(by=None, bins=10)
Parameters
by |
Optional. Specify columns in the DataFrame to group by as str or sequence. |
bins |
Optional. Specify the bins as int. It defines the number of equal-width bins. default is 10. |
Return Value
Return a histogram plot.
Example: Histogram example
In the example below, a DataFrame df is created. A histogram is created using this dataframe:
import pandas as pd
import numpy as np
import matplotlib.pyplot as plt
#providing seed for reproducibility
#of the result
np.random.seed(10)
df = pd.DataFrame(
np.random.randint(1, 10, 5000),
columns = ['Sample1']
)
df['Sample2'] = df['Sample1'] + np.random.randint(1, 10, 5000)
#displaying top 10 rows of the DataFrame
print(df.head(10),"\n")
#creating the plot
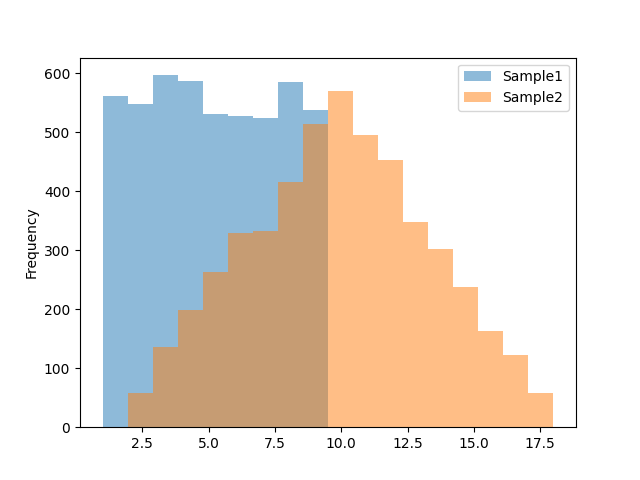
df.plot.hist(bins=18, alpha=0.5)
#displaying the plot
plt.show()
The output of the above code will be:
   Sample1  Sample2
0        5       11
1        1        9
2        2        5
3        1        2
4        2        8
5        9       15
6        1        2
7        9       14
8        7       16
9        5        9
❮ Pandas DataFrame - Functions
