Pandas DataFrame - plot.pie() function
A pie chart (or a circle chart) is a circular statistical graphic, which is divided into slices to illustrate numerical proportion. In a pie chart, the area of each slice is proportional to the quantity it represents.
The DataFrame.plot.pie() functions makes a pie plot. This function wraps matplotlib.pyplot.pie() for the specified column. If no column reference is passed and subplots=True, a pie plot is drawn for each numerical column independently.
Syntax
DataFrame.plot.pie(y=None)
Parameters
y |
Optional. Specify Label or position of the column to plot. If not provided, subplots=True argument must be passed. |
Return Value
Returns matplotlib.axes.Axes or an ndarray with one matplotlib.axes.Axes per column when subplots=True.
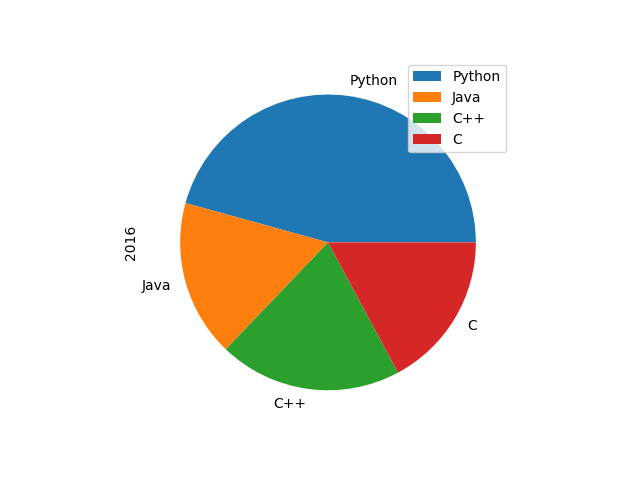
Example: pie plot on a single column
In the example below, a DataFrame NumberOfStudents is created. A pie plot is created containing information about number of student studying different languages for year 2016.
import pandas as pd
import numpy as np
import matplotlib.pyplot as plt

NumberOfStudents = pd.DataFrame({
  "2016": [160, 60, 70, 60],
  "2017": [175, 65, 75, 65]},
  index= ["Python", "Java", "C++", "C"]
)

#displaying the DataFrame
print(NumberOfStudents,"\n")
#creating the plot
NumberOfStudents.plot.pie(y='2016')

#displaying the plot
plt.show()
The output of the above code will be:
        2016  2017
Python   160   175
Java      60    65
C++       70    75
C         60    65
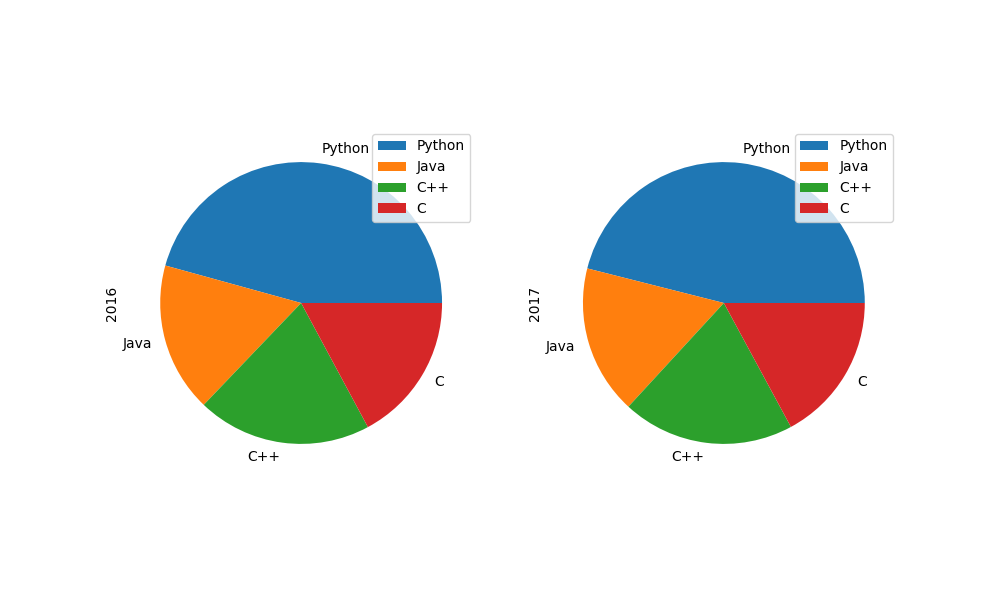
Example: pie plot on all columns
When no column reference is passed and subplots=True parameter is used, a pie plot is drawn for each numerical column independently. Consider the example below:
import pandas as pd
import numpy as np
import matplotlib.pyplot as plt

NumberOfStudents = pd.DataFrame({
  "2016": [160, 60, 70, 60],
  "2017": [175, 65, 75, 65]},
  index= ["Python", "Java", "C++", "C"]
)

#displaying the DataFrame
print(NumberOfStudents,"\n")
#creating the plot
NumberOfStudents.plot.pie(subplots=True,
                          figsize=(10, 6))

#displaying the plot
plt.show()
The output of the above code will be:
        2016  2017
Python   160   175
Java      60    65
C++       70    75
C         60    65
❮ Pandas DataFrame - Functions
