NumPy - linspace() function
The NumPy linspace() function returns evenly spaced values over a specified interval. The values are generated in the range [start, stop] with specified number of samples. The endpoint of the interval can optionally be excluded.
Syntax
numpy.linspace(start, stop, num=50, endpoint=True, retstep=False, dtype=None)
Parameters
start |
Required. Specify the starting value of the sequence. |
stop |
Required. Specify the end value of the sequence, unless endpoint is False. In that case, the sequence consists of all but the last of num + 1 evenly spaced samples, so that stop is excluded. Note that the step size changes when endpoint is False. |
num |
Optional. Specify the number of samples to generate. Default is 50. Must be non-negative. |
endpoint |
Optional. Specify boolean value. If True, stop is the last sample. Otherwise, it is not included. Default is True. |
retstep |
Optional. Specify boolean value. If True, return (samples, step), where step is the spacing between samples. |
dtype |
Optional. Specify type of the output array. If dtype is not given, infer the data type from the other input arguments. |
Return Value
Returns an array with elements within the specified range.
Example: creating array using linspace() function
In the example below, linspace() function is used with different parameters to create arrays.
import numpy as np

#creating 5 samples points in the given range
Arr1 = np.linspace(1,5,num=5)
print("Arr1 is:", Arr1)

#when endpoint=False, (num+1) samples are
#generated and returns samples without last
Arr2 = np.linspace(1,5,num=5,endpoint=False)
print("Arr2 is:", Arr2)

#when retstep=True, returns (samples, step)
Arr3 = np.linspace(1,5,num=5,retstep=True)
print("Arr3 is:", Arr3)
The output of the above code will be:
Arr1 is: [1. 2. 3. 4. 5.]
Arr2 is: [1.  1.8 2.6 3.4 4.2]
Arr3 is: (array([1., 2., 3., 4., 5.]), 1.0)
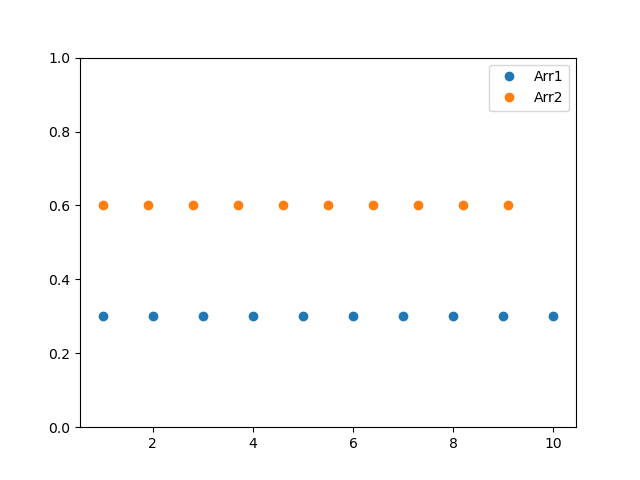
Example: Visualize the sample
In the example below, arrays are created by taking endpoint parameter as True and False, and plotted using matplolib library to visualize the result.
import numpy as np
import matplotlib.pyplot as plt

#creating 10 samples points using endpoint=True
Arr1 = np.linspace(1,10,num=10,endpoint=True)

#creating 10 samples using endpoint=True
Arr2 = np.linspace(1,10,num=10,endpoint=False)

y = np.zeros(10)

#plotting Arr1 and Arr2
plt.plot(Arr1, y+0.3, 'o')
plt.plot(Arr2, y+0.6, 'o')
plt.ylim([0,1])
plt.legend(labels = ('Arr1', 'Arr2'))
plt.show()
The output of the above code will be:
❮ NumPy - Functions
