NumPy - Statistical Functions
The NumPy package contains a number of statistical functions which provides all the functionality required for various statistical operations. It includes finding mean, median, average, standard deviation, variance and percentile etc from elements of a given array. Below mentioned are the most frequently used statistical functions:
| Function | Description |
|---|---|
| mean() | Computes the arithmetic mean along the specified axis. |
| median() | Computes the median along the specified axis. |
| average() | Computes the weighted average along the specified axis. |
| std() | Compute the standard deviation along the specified axis. |
| var() | Compute the variance along the specified axis. |
| amax() | Returns the maximum of an array or maximum along an axis. |
| amin() | Returns the minimum of an array or minimum along an axis. |
| ptp() | Return range of values (maximum - minimum) of an array or along an axis. |
| percentile() | Computes the specified percentile of the data along the specified axis. |
Lets discuss these functions in detail:
numpy.mean() function
The numpy.mean() function is used to compute the arithmetic mean along the specified axis. The mean is calculated over the flattened array by default, otherwise over the specified axis.
Syntax
numpy.mean(a, axis=None, dtype=None, out=None, keepdims=<no value>)
Parameters
a |
Required. Specify an array containing numbers whose mean is desired. If a is not an array, a conversion is attempted. |
axis |
Optional. Specify axis or axes along which the means are computed. The default is to compute the mean of the flattened array. |
dtype |
Optional. Specify the data type for computing the mean. For integer inputs, the default is float64. For floating point inputs, it is same as the input dtype. |
out |
Optional. Specify output array for the result. The default is None. If provided, it must have the same shape as output. |
keepdims |
Optional. If this is set to True, the reduced axes are left in the result as dimensions with size one. With this option, the result will broadcast correctly against the input array. With default value, the keepdims will not be passed through to the mean method of sub-classes of ndarray, but any non-default value will be. If the sub-class method does not implement keepdims the exceptions will be raised. |
Example:
In the example below, mean() function is used to calculate mean of all values present in the array. Along with this, when axis parameter is provided, mean is calculated over the specified axes.
import numpy as np
Arr = np.array([[10,20,30],[70,80,90]])

print("Array is:")
print(Arr)

#mean of all values
print("\nMean of all values:", np.mean(Arr))

#mean along axis=0
print("\nMean along axis=0")
print(np.mean(Arr, axis=0))

#mean along axis=1
print("\nMean along axis=1")
print(np.mean(Arr, axis=1))
The output of the above code will be:
Array is:
[[10 20 30]
 [70 80 90]]

Mean of all values: 50.0

Mean along axis=0
[40. 50. 60.]

Mean along axis=1
[20. 80.]
numpy.median() function
The numpy.median() function is used to compute the median along the specified axis. The median is calculated over the flattened array by default, otherwise over the specified axis.
Syntax
numpy.median(a, axis=None, out=None, overwrite_input=False, keepdims=False)
Parameters
a |
Required. Specify an array (array_like) containing numbers whose median is desired. |
axis |
Optional. Specify axis or axes along which the medians are computed. The default is to compute the median of the flattened array. |
out |
Optional. Specify output array for the result. The default is None. If provided, it must have the same shape as output. |
overwrite_input |
Optional. If True, the input array will be modified. If overwrite_input is True and a is not already an ndarray, an error will be raised. Default is False. |
keepdims |
Optional. If this is set to True, the reduced axes are left in the result as dimensions with size one. With this option, the result will broadcast correctly against the input array. |
Example:
In the example below, median() function is used to calculate median of all values present in the array. When axis parameter is provided, median is calculated over the specified axes.
import numpy as np
Arr = np.array([[10,20,500],[30,40,400], [100,200,300]])

print("Array is:")
print(Arr)

#median of all values
print("\nMedian of values:", np.median(Arr))

#median along axis=0
print("\nMedian along axis=0")
print(np.median(Arr, axis=0))

#median along axis=1
print("\nMedian along axis=1")
print(np.median(Arr, axis=1))
The output of the above code will be:
Array is:
[[ 10  20 500]
 [ 30  40 400]
 [100 200 300]]

Median of values: 100.0

Median along axis=0
[ 30.  40. 400.]

Median along axis=1
[ 20.  40. 200.]
numpy.average() function
The numpy.average() function is used to compute the weighted average along the specified axis. The syntax for using this function is given below:
Syntax
numpy.average(a, axis=None, weights=None, returned=False)
Parameters
a |
Required. Specify an array containing data to be averaged. If a is not an array, a conversion is attempted. |
axis |
Optional. Specify axis or axes along which to average a. The default, axis=None, will average over all of the elements of the input array. If axis is negative it counts from the last to the first axis. |
weight |
Optional. Specify an array of weights associated with the values in a. The weights array can either be 1-D (in which case its length must be the size of a along the given axis) or of the same shape as a. If weights=None, then all data in a are assumed to have a weight equal to one. |
returned |
Optional. Default is False. If True, the tuple (average, sum_of_weights) is returned, otherwise only the average is returned. |
Example:
In the example below, average() function is used to calculate average of all values present in the array. When axis parameter is provided, averaging is performed over the specified axes. Consider the following example.
import numpy as np
Arr = np.array([[10,20,30],[70,80,90]])

print("Array is:")
print(Arr)

#average of all values
print("\nAverage of values:", np.average(Arr))

#averaging along axis=0
print("\nAverage along axis=0")
print(np.average(Arr, axis=0))

#averaging along axis=1
print("\nAverage along axis=1")
print(np.average(Arr, axis=1))
The output of the above code will be:
Array is:
[[10 20 30]
 [70 80 90]]

Average of values: 50.0

Average along axis=0
[40. 50. 60.]

Average along axis=1
[20. 80.]
Example:
In the example below, weight array is provided to calculate weighted average along the specified axis.
import numpy as np
Arr = np.array([[10,20],[80,90]])
w = np.array([0.4, 0.6])
print("Array is:")
print(Arr)

#averaging along axis=0
print("\nWeighted Average along axis=0")
print(np.average(Arr, axis=0, weights=w))

#averaging along axis=1
print("\nWeighted Average along axis=1")
print(np.average(Arr, axis=1, weights=w))
The output of the above code will be:
Array is:
[[10 20]
 [80 90]]

Weighted Average along axis=0
[52. 62.]

Weighted Average along axis=1
[16. 86.]
numpy.std() function
The numpy.std() function is used to compute the standard deviation along the specified axis. The standard deviation is defined as the square root of the average of the squared deviations from the mean. Mathematically, it can be represented as:
std = sqrt(mean(abs(x - x.mean())**2))
Syntax
numpy.std(a, axis=None, dtype=None, out=None, keepdims=<no value>)
Parameters
a |
Required. Specify the input array. |
axis |
Optional. Specify axis or axes along which the standard deviation is calculated. The default, axis=None, computes the standard deviation of the flattened array. |
dtype |
Optional. Specify the type to use in computing the standard deviation. For arrays of integer type the default is float64, for arrays of float types it is the same as the array type. |
out |
Optional. Specify the output array in which to place the result. It must have the same shape as the expected output. |
keepdims |
Optional. If this is set to True, the reduced axes are left in the result as dimensions with size one. With this option, the result will broadcast correctly against the input array. |
Example:
Here, std() function is used to calculate standard deviation of all values present in the array. But, when axis parameter is provided, standard deviation is calculated over the specified axes as shown in the example below.
import numpy as np
Arr = np.array([[10,20,30],[70,80,90]])

print("Array is:")
print(Arr)

#standard deviation of all values
print("\nStandard deviation of all values:", np.std(Arr))

#standard deviation along axis=0
print("\nStandard deviation along axis=0")
print(np.std(Arr, axis=0))

#standard deviation along axis=1
print("\nStandard deviation along axis=1")
print(np.std(Arr, axis=1))
The output of the above code will be:
Array is:
[[10 20 30]
 [70 80 90]]

Standard deviation of all values: 31.09126351029605

Standard deviation along axis=0
[30. 30. 30.]

Standard deviation along axis=1
[8.16496581 8.16496581]
numpy.var() function
The numpy.var() function is used to compute the variance along the specified axis. The variance is a measure of the spread of a distribution. The variance is computed for the flattened array by default, otherwise over the specified axis.
Syntax
numpy.var(a, axis=None, dtype=None, out=None, keepdims=<no value>)
Parameters
a |
Required. Specify the input array. |
axis |
Optional. Specify axis or axes along which the variance is calculated. The default, axis=None, computes the variance of the flattened array. |
dtype |
Optional. Specify the type to use in computing the variance. For arrays of integer type the default is float64, for arrays of float types it is the same as the array type. |
out |
Optional. Specify the output array in which to place the result. It must have the same shape as the expected output. |
keepdims |
Optional. If this is set to True, the reduced axes are left in the result as dimensions with size one. With this option, the result will broadcast correctly against the input array. |
Example:
In the example below, var() function is used to calculate variance of all values present in the array. When axis parameter is provided, variance is calculated over the specified axes.
import numpy as np
Arr = np.array([[10,20,30],[70,80,90]])

print("Array is:")
print(Arr)

#variance of all values
print("\nVariance of all values:", np.var(Arr))

#variance along axis=0
print("\nVariance along axis=0")
print(np.var(Arr, axis=0))

#variance along axis=1
print("\nVariance along axis=1")
print(np.var(Arr, axis=1))
The output of the above code will be:
Array is:
[[10 20 30]
 [70 80 90]]

Variance of all values: 966.6666666666666

Variance along axis=0
[900. 900. 900.]

Variance along axis=1
[66.66666667 66.66666667]
numpy.amax() function
The NumPy amax() function returns the maximum of an array or maximum along the specified axis.
Syntax
numpy.amax(a, axis=None, out=None, keepdims=<no value>)
Parameters
a |
Required. Specify the input array. |
axis |
Optional. Specify axis or axes along which to operate. The default, axis=None, operation is performed on flattened array. |
out |
Optional. Specify the output array in which to place the result. It must have the same shape as the expected output. |
keepdims |
Optional. If this is set to True, the reduced axes are left in the result as dimensions with size one. With this option, the result will broadcast correctly against the input array. |
Example:
In the example below, amax() function is used to calculate maximum of an array. When axis parameter is provided, maximum is calculated over the specified axes.
import numpy as np
Arr = np.array([[10,20,30],[70,80,90]])

print("Array is:")
print(Arr)

#maximum of all values
print("\nMaximum of all values:", np.amax(Arr))

#maximum along axis=0
print("\nMaximum along axis=0")
print(np.amax(Arr, axis=0))

#maximum along axis=1
print("\nMaximum along axis=1")
print(np.amax(Arr, axis=1))
The output of the above code will be:
Array is:
[[10 20 30]
 [70 80 90]]

Maximum of all values: 90

Maximum along axis=0
[70 80 90]

Maximum along axis=1
[30 90]
numpy.amin() function
The NumPy amin() function returns the minimum of an array or minimum along the specified axis.
Syntax
numpy.amin(a, axis=None, out=None, keepdims=<no value>)
Parameters
a |
Required. Specify the input array. |
axis |
Optional. Specify axis or axes along which to operate. The default, axis=None, operation is performed on flattened array. |
out |
Optional. Specify the output array in which to place the result. It must have the same shape as the expected output. |
keepdims |
Optional. If this is set to True, the reduced axes are left in the result as dimensions with size one. With this option, the result will broadcast correctly against the input array. |
Example:
In the example below, amin() function is used to calculate minimum of an array. When axis parameter is provided, minimum is calculated over the specified axes.
import numpy as np
Arr = np.array([[10,20,30],[70,80,90]])

print("Array is:")
print(Arr)

#minimum of all values
print("\nMinimum of all values:", np.amin(Arr))

#minimum along axis=0
print("\nMinimum along axis=0")
print(np.amin(Arr, axis=0))

#minimum along axis=1
print("\nMinimum along axis=1")
print(np.amin(Arr, axis=1))
The output of the above code will be:
Array is:
[[10 20 30]
 [70 80 90]]

Minimum of all values: 10

Minimum along axis=0
[10 20 30]

Minimum along axis=1
[10 70]
numpy.ptp() function
The NumPy ptp() function returns range of values (maximum - minimum) of an array or range of values along the specified axis.
The name of the function comes from the acronym for peak to peak.
Syntax
numpy.ptp(a, axis=None, out=None, keepdims=<no value>)
Parameters
a |
Required. Specify the input array. |
axis |
Optional. Specify axis or axes along which to operate. The default, axis=None, operation is performed on flattened array. |
out |
Optional. Specify the output array in which to place the result. It must have the same shape as the expected output. |
keepdims |
Optional. If this is set to True, the reduced axes are left in the result as dimensions with size one. With this option, the result will broadcast correctly against the input array. |
Example
In the example below, ptp() function is used to calculate the range of values present in the array. When axis parameter is provided, it is calculated over the specified axes.
import numpy as np
Arr = np.array([[10,20,30],[70,80,90]])

print("Array is:")
print(Arr)

#range of values
print("\nRange of values:", np.ptp(Arr))

#Range of values along axis=0
print("\nRange of values along axis=0")
print(np.ptp(Arr, axis=0))

#Range of values along axis=1
print("\nRange of values along axis=1")
print(np.ptp(Arr, axis=1))
The output of the above code will be:
Array is:
[[10 20 30]
 [70 80 90]]

Range of values: 80

Range of values along axis=0
[60 60 60]

Range of values along axis=1
[20 20]
numpy.percentile() function
The NumPy percentile() function returns the q-th percentile of the array elements or q-th percentile the data along the specified axis.
Syntax
numpy.percentile(a, q, axis=None, out=None,
                 interpolation='linear', keepdims=False)
Parameters
a |
Required. Specify the input array (array_like). |
q |
Required. Specify percentile or sequence of percentiles to compute, which must be between 0 and 100 inclusive (array_like of float). |
axis |
Optional. Specify axis or axes along which to operate. The default, axis=None, operation is performed on flattened array. |
out |
Optional. Specify the output array in which to place the result. It must have the same shape as the expected output. |
interpolation |
Optional. Specify the interpolation method to use when the desired percentile lies between two data points. It can take value from {'linear', 'lower', 'higher', 'midpoint', 'nearest'} |
keepdims |
Optional. If this is set to True, the reduced axes are left in the result as dimensions with size one. With this option, the result will broadcast correctly against the input array. |
Example:
In the example below, percentile() function returns the maximum of all values present in the array. When axis parameter is provided, it is calculated over the specified axes.
import numpy as np
Arr = np.array([[10,20, 30],[40, 50, 60]])

print("Array is:")
print(Arr)

print()
#calculating 50th percentile point
print("50th percentile:", np.percentile(Arr, 50))

print()
#calculating (25, 50, 75) percentile points
print("[25, 50, 75] percentile:\n",
       np.percentile(Arr, (25, 50, 75)))

print()
#calculating 50th percentile point along axis=0
print("50th percentile (axis=0):",
       np.percentile(Arr, 50, axis=0))

#calculating 50th percentile point along axis=1
print("50th percentile (axis=1):",
       np.percentile(Arr, 50, axis=1))
The output of the above code will be:
Array is:
[[10 20 30]
 [40 50 60]]

50th percentile: 35.0

[25, 50, 75] percentile:
 [22.5 35.  47.5]

50th percentile (axis=0): [25. 35. 45.]
50th percentile (axis=1): [20. 50.]
Example:
The interpolation parameter can be used to specify the interpolation method to be used while calculating percentile points. Consider the example below:
import numpy as np
Arr = np.array([[10,20, 30],[40, 50, 60]])

print("Array is:")
print(Arr)

print()
#calculating 50th percentile point
print("50th percentile:",
      np.percentile(Arr, 50, interpolation='lower'))

print()
#calculating (25, 50, 75) percentile points
print("[25, 50, 75] percentile:\n",
       np.percentile(Arr, (25, 50, 75), interpolation='lower'))
The output of the above code will be:
Array is:
[[10 20 30]
 [40 50 60]]

50th percentile: 30

[25, 50, 75] percentile:
 [20 30 40]
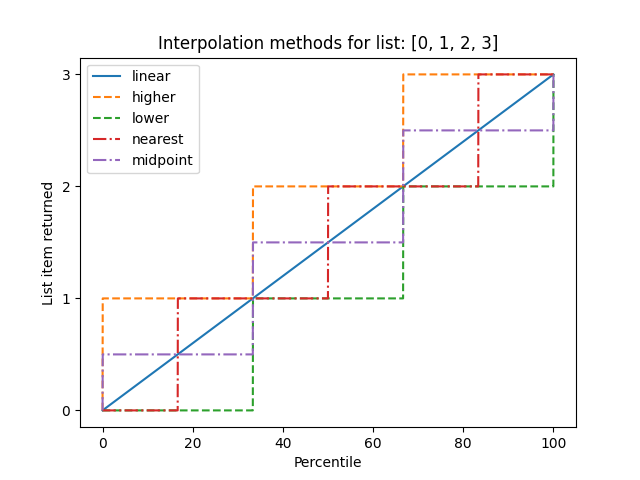
Example:
The different types of interpolation can be visualized graphically:
import numpy as np
import matplotlib.pyplot as plt

x = [0, 1, 2, 3]
p = np.linspace(0, 100, 5000)

fig, ax = plt.subplots()

lines = [
    ('linear', None),
    ('higher', '--'),
    ('lower', '--'),
    ('nearest', '-.'),
    ('midpoint', '-.'),
]

for method, style in lines:
  ax.plot(p, np.percentile(x, p, interpolation=method),
        label=method, linestyle=style)

ax.set(title='Interpolation methods for list: ' + str(x),
       xlabel='Percentile',
       ylabel='List item returned',
       yticks=x)
ax.legend()
plt.show()
The output of the above code will be: