NumPy - Histogram
The NumPy histogram() function is used to compute the histogram of a set of data. The syntax for using this function is given below:
Syntax
numpy.histogram(a, bins=10, range=None, normed=None, weights=None, density=None)
Parameters
a |
Required. Specify the input data, The histogram is computed over the flattened array. |
bins |
Optional. Specify the bins. If bins is an int, it defines the number of equal-width bins in the given range (10, by default). If bins is a sequence, it defines a monotonically increasing array of bin edges, including the rightmost edge, allowing for non-uniform bin widths. |
range |
Optional. Specify the lower and upper range of the bins. If not provided, range is simply (a.min(), a.max()). Values outside the range are ignored. The first element of the range must be less than or equal to the second. |
normed |
Optional. Equivalent to the density argument. Deprecated since version 1.6.0. |
weights |
Optional. Specify an array of weights, of the same shape as a. |
density |
Optional. If it is set to False, the result will contain the number of samples in each bin. If True, the result is the value of the probability density function at the bin. |
Return Value
Returns the values of the histogram.
Example: creating histogram
In the example below, the histogram() function is used to create values of the histogram.
import numpy as np

Arr = np.arange(101)

#creates 10 bins - each bin contains 10 elements
#and last bin contains 11 elements. For example
#[0,10) bin will contain 0, 1, ..., 9.
HistArr = np.histogram(Arr)

print(HistArr)
The output of the above code will be:
(array([10, 10, 10, 10, 10, 10, 10, 10, 10, 11]),
 array([  0.,  10.,  20.,  30.,  40.,  50.,  60.,  70.,  80.,  90., 100.]))
Example: histogram with bins and range parameters
The bins parameter is used to specify number of bins in the histogram and range parameter is used to specify the data range used for creating histogram.
import numpy as np

Arr = np.arange(101)

#creates 5 bins for range [0, 40] - each bin contains
#8 elements and last bin contains 9 elements
HistArr = np.histogram(Arr, bins=5, range=(0,40))

print(HistArr)
The output of the above code will be:
(array([8, 8, 8, 8, 9]),
 array([ 0.,  8., 16., 24., 32., 40.]))
Example: histogram with bins and density parameters
In the example below, the bins parameter is provided as sequence with density parameter. The sequence defines the bin edges and density is set to True to get the probability density function at the bin.
import numpy as np

Arr = np.arange(101)
b = np.array([0,10,20,30,40])
HistArr1 = np.histogram(Arr, bins=b, density=False)
HistArr2 = np.histogram(Arr, bins=b, density=True)

print("HistArr1 is:")
print(HistArr1)
print("\nHistArr2 is:")
print(HistArr2)
The output of the above code will be:
HistArr1 is:
(array([10, 10, 10, 11]),
 array([ 0, 10, 20, 30, 40]))

HistArr2 is:
(array([0.02439024, 0.02439024, 0.02439024, 0.02682927]),
 array([ 0, 10, 20, 30, 40]))
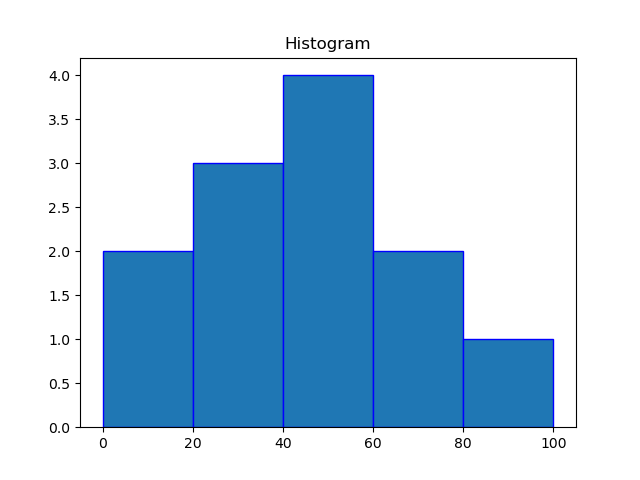
Example: plotting histogram using matplotlib
Matplotlib is a plotting library for the Python programming language. The hist() function of matplotlib is similar to histogram() function of numpy which can be used with numpy object to create histogram graphically as shown in the example below.
import matplotlib.pyplot as plt
import numpy as np

Arr = np.array([45,64,5,22,55,89,59,35,78,42,34,15])
b = np.array([0,20,40,60,80,100])

plt.hist(Arr, bins = b, edgecolor='blue')
plt.title("Histogram")
plt.show()
The output of the above code will be: