NumPy - percentile() function
The NumPy percentile() function returns the q-th percentile of the array elements or q-th percentile the data along the specified axis.
Syntax
numpy.percentile(a, q, axis=None, out=None,
                 interpolation='linear', keepdims=False)
Parameters
a |
Required. Specify the input array (array_like). |
q |
Required. Specify percentile or sequence of percentiles to compute, which must be between 0 and 100 inclusive (array_like of float). |
axis |
Optional. Specify axis or axes along which to operate. The default, axis=None, operation is performed on flattened array. |
out |
Optional. Specify the output array in which to place the result. It must have the same shape as the expected output. |
interpolation |
Optional. Specify the interpolation method to use when the desired percentile lies between two data points. It can take value from {'linear', 'lower', 'higher', 'midpoint', 'nearest'} |
keepdims |
Optional. If this is set to True, the reduced axes are left in the result as dimensions with size one. With this option, the result will broadcast correctly against the input array. |
Return Value
Returns percentile points of a. If q is a single percentile and axis=None, then the result is a scalar. In other cases, the result is an array.
Example: percentile() of flattened array
In the example below, percentile() function is used to return the maximum of all values present in the array.
import numpy as np
Arr = np.array([[10,20, 30],[40, 50, 60]])

print("Array is:")
print(Arr)

print()
#calculating 50th percentile point
print("50th percentile:", np.percentile(Arr, 50))

print()
#calculating (25, 50, 75) percentile points
print("[25, 50, 75] percentile:\n",
       np.percentile(Arr, (25, 50, 75)))
The output of the above code will be:
Array is:
[[10 20 30]
 [40 50 60]]

50th percentile: 35.0

[25, 50, 75] percentile:
 [22.5 35.  47.5]
Example: using axis parameter
When axis parameter is provided, the percentile points are calculated over the specified axes. Consider the following example.
import numpy as np
Arr = np.array([[10,20, 30],[40, 50, 60]])

print("Array is:")
print(Arr)

print()
#calculating 50th percentile point along axis=0
print("50th percentile (axis=0):",
       np.percentile(Arr, 50, axis=0))

#calculating 50th percentile point along axis=1
print("50th percentile (axis=1):",
       np.percentile(Arr, 50, axis=1))
The output of the above code will be:
Array is:
[[10 20 30]
 [40 50 60]]

50th percentile (axis=0): [25. 35. 45.]
50th percentile (axis=1): [20. 50.]
Example: using interpolation parameter
The interpolation parameter can be used to specify the interpolation method to be used while calculating percentile points. Consider the example below:
import numpy as np
Arr = np.array([[10,20, 30],[40, 50, 60]])

print("Array is:")
print(Arr)

print()
#calculating 50th percentile point
print("50th percentile:",
      np.percentile(Arr, 50, interpolation='lower'))

print()
#calculating (25, 50, 75) percentile points
print("[25, 50, 75] percentile:\n",
       np.percentile(Arr, (25, 50, 75), interpolation='lower'))
The output of the above code will be:
Array is:
[[10 20 30]
 [40 50 60]]

50th percentile: 30

[25, 50, 75] percentile:
 [20 30 40]
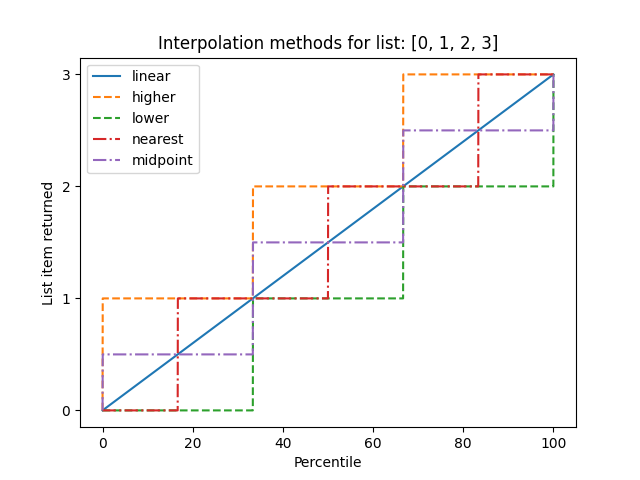
Example: visualize interpolation method
The different types of interpolation can be visualized graphically:
import numpy as np
import matplotlib.pyplot as plt

x = [0, 1, 2, 3]
p = np.linspace(0, 100, 5000)

fig, ax = plt.subplots()

lines = [
    ('linear', None),
    ('higher', '--'),
    ('lower', '--'),
    ('nearest', '-.'),
    ('midpoint', '-.'),
]

for method, style in lines:
  ax.plot(p, np.percentile(x, p, interpolation=method),
        label=method, linestyle=style)

ax.set(title='Interpolation methods for list: ' + str(x),
       xlabel='Percentile',
       ylabel='List item returned',
       yticks=x)
ax.legend()
plt.show()
The output of the above code will be:
❮ NumPy - Functions
