NumPy - meshgrid() function
The NumPy meshgrid() function returns coordinate matrices from coordinate vectors. It makes N-D coordinate arrays for vectorized evaluations of N-D scalar/vector fields over N-D grids, given one-dimensional coordinate arrays x1, x2,…, xn.
Syntax
numpy.meshgrid(*xi, copy=True, sparse=False, indexing='xy')
Parameters
x1, x2,…, xn |
Required. Specify 1-D arrays (array_like) representing the coordinates of a grid. |
Return Value
For vectors x1, x2,…, xn with lengths Ni=len(xi), returns (N2, N1, N3,...Nn) shaped arrays with the elements of xi repeated to fill the matrix along the first dimension for x1, the second for x2 and so on.
Example:
The example below shows the usage of meshgrid() function.
import numpy as np
x = [1, 2, 3, 4, 5]
y = [11, 12, 13, 14, 15]

#using meshgrid() function to get
#two 2-dimensional arrays
x_new, y_new = np.meshgrid(x, y)

#displaying the result
print("x_new:")
print(x_new)
print("\ny_new:")
print(y_new)
The output of the above code will be:
x_new:
[[1 2 3 4 5]
 [1 2 3 4 5]
 [1 2 3 4 5]
 [1 2 3 4 5]
 [1 2 3 4 5]]

y_new:
[[11 11 11 11 11]
 [12 12 12 12 12]
 [13 13 13 13 13]
 [14 14 14 14 14]
 [15 15 15 15 15]]
Plotting functions
The output from the meshgrid() function can be used to plot functions.
Example:
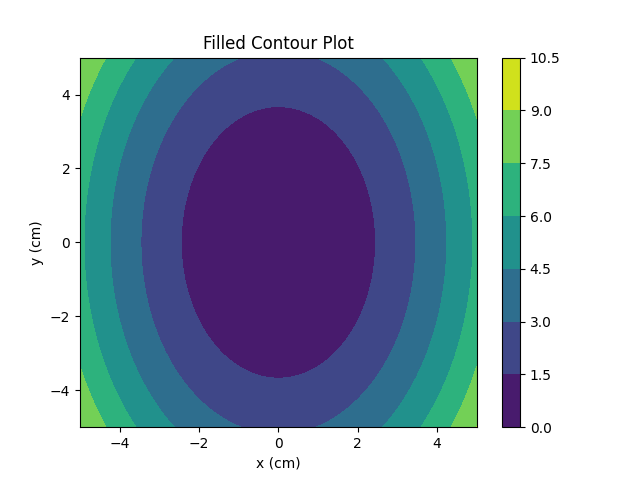
In the example below, matplotlib contourf() function to draw a filled contour plot of a elliptical plane.
import matplotlib.pyplot as plt
import numpy as np

xlist = np.linspace(-5.0, 5.0, 100)
ylist = ylist = np.linspace(-5.0, 5.0, 100)
X, Y = np.meshgrid(xlist, ylist)

#creating elliptical plane
Z = (X**2)/4 + (Y**2)/9

fig, ax = plt.subplots()

#drawing filled contour plot
cb = ax.contourf(X, Y, Z)
#Adding a colorbar to the plot
fig.colorbar(cb)

ax.set_title('Filled Contour Plot')
ax.set_xlabel('x (cm)')
ax.set_ylabel('y (cm)')

plt.show()
The output of the above code will be:

❮ NumPy - Functions


