R - Box Plot
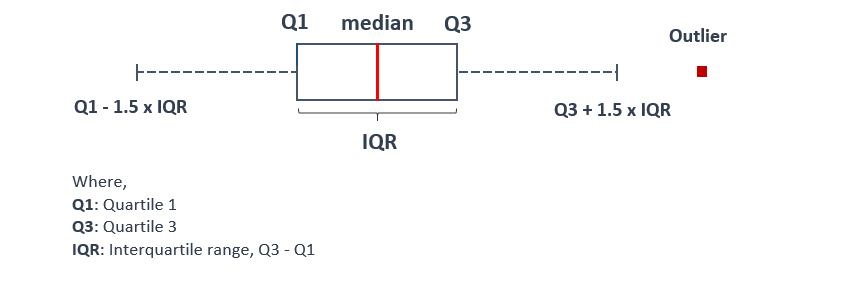
A box plot also known as a whisker plot is a method for graphically describing groups of numerical data through their quartiles. The box is drawn from first quartile (Q1) to third quartile (Q3) , indicating position of the median in the dataset. The whiskers extend from the box to show the range of the data.
The R boxplot() function makes a box and whisker plot for each column of x or each vector in sequence x.
Syntax
boxplot(x, data, main, xlab, ylab, notch,
        names, horizontal, col, border)
Parameters
x |
Required. Specify a vector or a formula. |
data |
Optional. Specify tha data frame. |
main, xlab, ylab |
Optional. Used to specify main title, x axis label and y axis label respectively. |
notch |
Optional. Specify boolean value, when TRUE draws a notch. |
names |
Optional. Specify group labels give name for each box plot. |
horizontal |
Optional. Specify boolean value, when TRUE horizontal box plot is drawn. |
col |
Optional. Specify a color to be used to fill the box plot. |
border |
Optional. Specify the color of the border around the bars. |
Example:
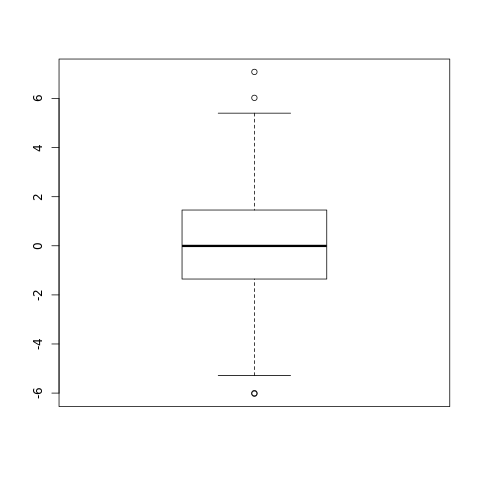
In the example below, a random normally distributed dataset is created using rnorm() function. The sample contains 1000 records. Using this dataset, a box plot is drawn.
#fixing the seed to maintain the
#reproducibility of the result
set.seed(10)

#creating a vector containing 1000
#normally distributed random values
x <- rnorm(1000, 0, 2)

#naming the file
png(file = "boxplot.png")

#drawing the boxplot
boxplot(x)

#saving the file
dev.off()
The output of the above code will be:
Example: Add features to a box plot
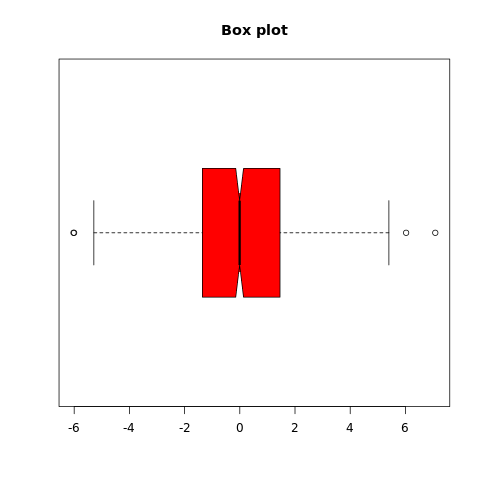
More features in the plot can be added using more parameters in the function, for example: to add title to the plot, main parameter is used and notch can be set TRUE to get notched box plot. Similarly, horizontal can be set TRUE to get horizontal box plot and col parameter can be used to fill color in the box plot.
#fixing the seed to maintain the
#reproducibility of the result
set.seed(10)

#creating a vector containing 1000
#normally distributed random values
x <- rnorm(1000, 0, 2)

#naming the file
png(file = "boxplot.png")

#drawing the boxplot
boxplot(x, notch=TRUE, horizontal=TRUE,
        main="Box plot", col="red")

#saving the file
dev.off()
The output of the above code will be:
Multiple Box Plots
To draw multiple box plots in a single plot a formula can be used. It can also be achieved by passing multiple vectors in the function.
Example:
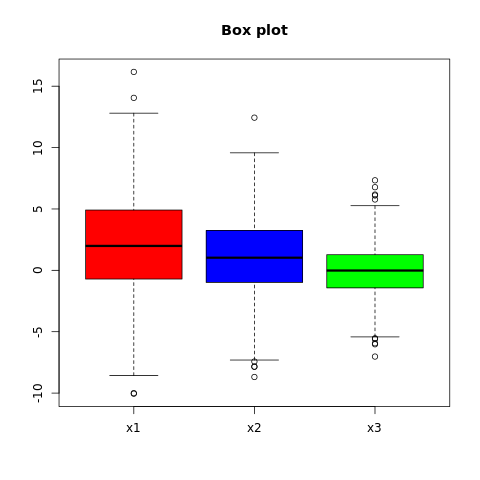
In the example below, three random normally distributed dataset is created using rnorm() function. Each samples contains 1000 records. Using these dataset, a box plot is drawn.
#fixing the seed to maintain the
#reproducibility of the result
set.seed(10)

#creating three vector containing 1000
#normally distributed random values each
#with different mean and standard deviation
x1 <- rnorm(1000, 2, 4)
x2 <- rnorm(1000, 1, 3)
x3 <- rnorm(1000, 0, 2)

#naming the file
png(file = "boxplot.png")

#drawing the boxplot
boxplot(x1, x2, x3, main="Box plot",
        col = c("red", "blue", "green"),
        names = c("x1", "x2", "x3"))

#saving the file
dev.off()
The output of the above code will be: