R - Dendrogram
A dendrogram (or tree diagram) is a network structure. It is constituted of a root node that gives birth to several nodes connected by edges or branches. The last nodes of the hierarchy are called leaves. The diagram can be visualized as a tree.
Basic Dendrogram
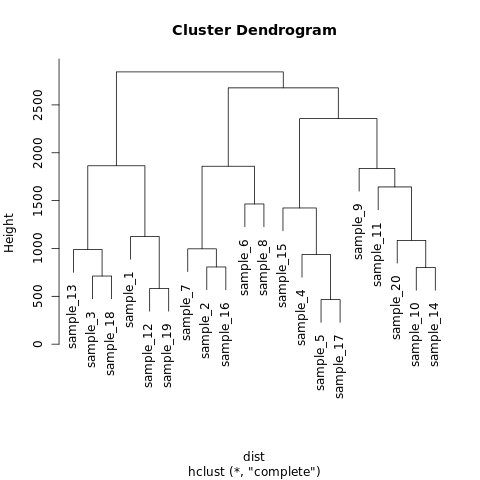
Hierarchical clustering is a common task in data science and can be performed with the hclust() function in R. The following examples will guide through the process, showing how to prepare the data, how to run the clustering and how to build an appropriate chart to visualize its result.
Example:
The input dataset is a matrix where each row is a sample, and each column is a variable. Clustering is performed on a square matrix that provides the distance between samples. It can be computed using the dist() or the cor() function. Then the hclust() function is used to perform the hierarchical clustering.
#Dataset
data <- matrix(sample(seq(1, 2000),200), ncol = 10)
rownames(data) <- paste0("sample_" , seq(1,20))
colnames(data) <- paste0("variable", seq(1,10))

#Euclidean distance
dist <- dist(data[ , c(4:8)] , diag=TRUE)

#naming the file
png(file = "Dendrogram.png")

#Hierarchical Clustering with hclust
hc <- hclust(dist)

#Plot the result
plot(hc)

#saving the file
dev.off()
The output of the above code will be:
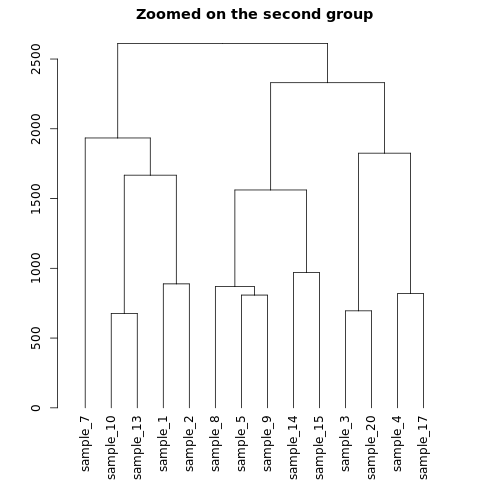
Zoom on a group
It is possible to zoom on a specific part of the tree. Select the group of interest using the [[..]] operator.
Example:
Consider the example below, in which dendrogram is zoomed at the second group.
#Dataset
data <- matrix(sample(seq(1, 2000),200), ncol = 10)
rownames(data) <- paste0("sample_" , seq(1,20))
colnames(data) <- paste0("variable", seq(1,10))

#Euclidean distance
dist <- dist(data[ , c(4:8)] , diag=TRUE)

#naming the file
png(file = "Dendrogram.png")

#Hierarchical Clustering with hclust
hc <- hclust(dist)

#store the dedrogram in an object
dhc <- as.dendrogram(hc)

#set the margin
par(mar=c(4,4,2,2))

#Plot the second group
plot(dhc[[2]], main= "Zoomed on the second group")

#saving the file
dev.off()
The output of the above code will be: