Matplotlib - 3D Bar Plot
A three-dimensional axes can be created by passing projection='3d' keyword to the axes creation routine. After creating 3D axes, matplotlib.Axes3D.bar() function is used to add 2D bars and make 3D bar plot.
Syntax
matplotlib.Axes3D.bar(left, height, zs=0, zdir='z')
Parameters
left |
Required. Specify the x coordinates of the left sides of the bars. 1D array-like. |
height |
Required. Specify the heights of the bars. 1D array-like. |
zs |
Optional. Specify z coordinate of bars; if a single value is specified, it will be used for all bars. float or 1D array-like. |
zdir |
Optional. When plotting 2D data, the direction to use as z ('x', 'y' or 'z'). Default is 'z'. |
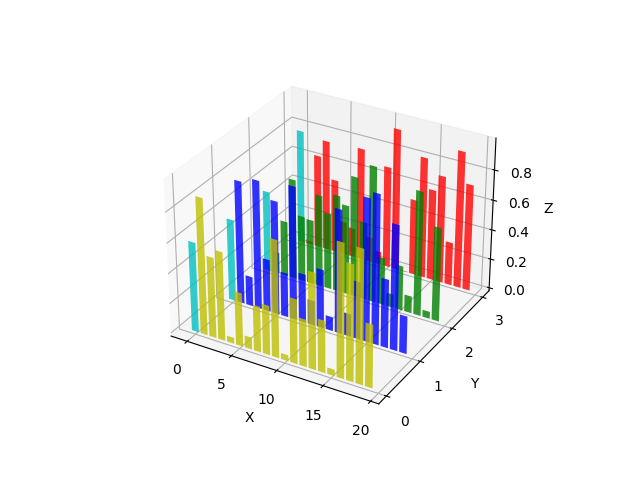
Example: 3D bar plot
In the example below, a 3D bar plot is plotted on four set of data set. Each data set contains 20 bars, each with random height between 0 to 1.
import matplotlib.pyplot as plt
import numpy as np

#Fixing random state
np.random.seed(10)

colors = ['r', 'g', 'b', 'y']
yticks = [3, 2, 1, 0]

fig = plt.figure()
ax = fig.add_subplot(111, projection='3d')
ax.set_xlabel('X')
ax.set_ylabel('Y')
ax.set_zlabel('Z')
ax.set_yticks(yticks)

for c, k in zip(colors, yticks):
  #Generate the random data for the y=k 'layer'.
  xs = np.arange(20)
  ys = np.random.rand(20)

  #providing color to the series
  cs = [c] * len(xs)
  cs[0] = 'c'

  # Plot the 3D bar graph given by xs and ys
  #on the plane y=k with 80% opacity.
  ax.bar(xs, ys, zs=k, zdir='y',
            color=cs, alpha=0.8)

plt.show()
The output of the above code will be: