Matplotlib - 3D Contour Plot
When projection='3d' keyword is passed to the axes creation routine, it creates three-dimensional axes. After creating 3D axes, matplotlib.Axes3D.contour() and matplotlib.Axes3D.contourf() functions are used to draw contour lines and filled contours, respectively.
Syntax
matplotlib.Axes3D.contour([X, Y,] Z, [levels])
matplotlib.Axes3D.contourf([X, Y,] Z, [levels])
Parameters
X, Y |
Optional. Specify 2-D numpy arrays with same shape as Z or 1-D arrays such that len(X) == M is the number of columns in Z and len(Y) == N is the number of rows in Z. |
Z |
Required. Specify the height values over which the contour is drawn. (M, N) array-like. |
levels |
Optional. Determines the number and positions of the contour lines / regions. int or array-like. |
Example: 3D contour plot
In the example below, the contour() function to draw contour lines of an elliptical plane.
import matplotlib.pyplot as plt
import numpy as np

xlist = np.linspace(-5.0, 5.0, 100)
ylist = ylist = np.linspace(-5.0, 5.0, 100)
X, Y = np.meshgrid(xlist, ylist)

#creating elliptical plane
Z = (X**2)/4 + (Y**2)/9

fig = plt.figure()
ax = fig.add_subplot(111, projection='3d')

#drawing contour plot
cb = ax.contour(X, Y, Z, 100)

ax.set_title('3D Contour Plot')
ax.set_xlabel('x (cm)')
ax.set_ylabel('y (cm)')
ax.set_zlabel('z (cm)')

plt.show()
The output of the above code will be:

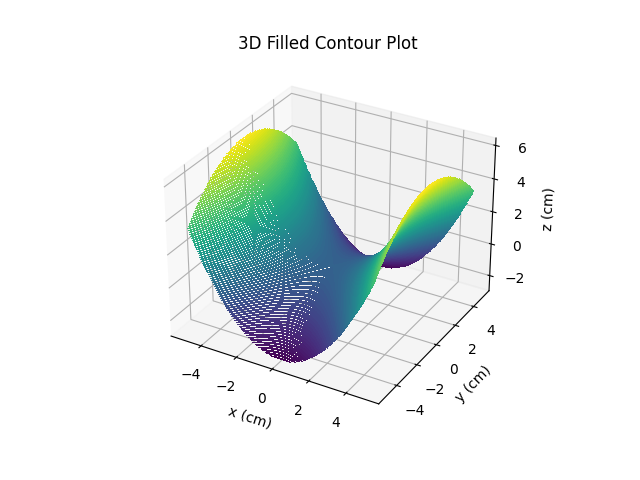
Example: filled contour plot
By using contourf() function, we can get filled contour plot.
import matplotlib.pyplot as plt
import numpy as np

xlist = np.linspace(-5.0, 5.0, 100)
ylist = ylist = np.linspace(-5.0, 5.0, 100)
X, Y = np.meshgrid(xlist, ylist)

#creating hyperbolic plane
Z = (X**2)/4 - (Y**2)/9

fig = plt.figure()
ax = fig.add_subplot(111, projection='3d')

#drawing filled contour plot
cb = ax.contourf(X, Y, Z, 100)

ax.set_title('3D Filled Contour Plot')
ax.set_xlabel('x (cm)')
ax.set_ylabel('y (cm)')
ax.set_zlabel('z (cm)')

plt.show()
The output of the above code will be: