Matplotlib - Stream Plot
Stream plot is basically a type of 2D plot which shows fluid flows and 2D field gradients. The matplotlib.pyplot.streamplot() function is used to make stream plot. The syntax for using this function is given below:
Syntax
matplotlib.pyplot.streamplot(x, y, u, v, density=1)
Parameters
x, y |
Optional. 1D/2D arrays. Specify evenly spaced strictly increasing arrays to make a grid. |
u, v |
Required. Specify x and y velocities. The number of rows and columns must match the length of y and x, respectively. |
density |
Optional. Specify float or (float, float). Controls the closeness of streamlines. |
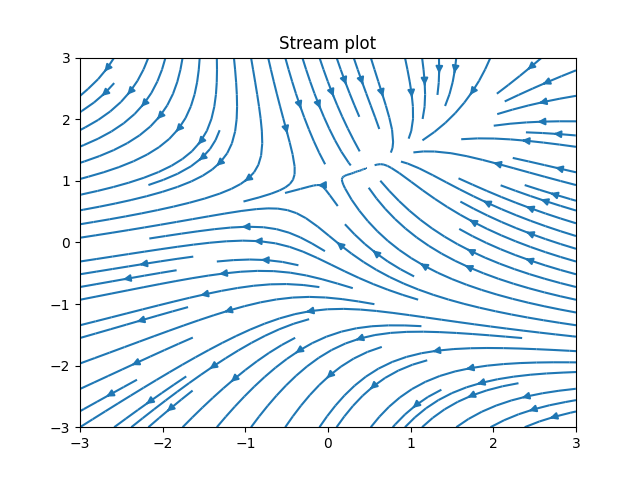
Example: stream plot
In the example below, the streamplot() function is used to create a stream plot of a given dataset.
import matplotlib.pyplot as plt
import numpy as np

# Creating data set
w = 3
Y, X = np.mgrid[-w:w:100j, -w:w:100j]
U = -1 - X**2 + Y
V = 1 + X - Y**2
speed = np.sqrt(U**2 + V**2)

fig, ax = plt.subplots()
ax.set_title("Stream plot")

#drawing stream plot
ax.streamplot(X, Y, U, V, density = 1)

plt.show()
The output of the above code will be:
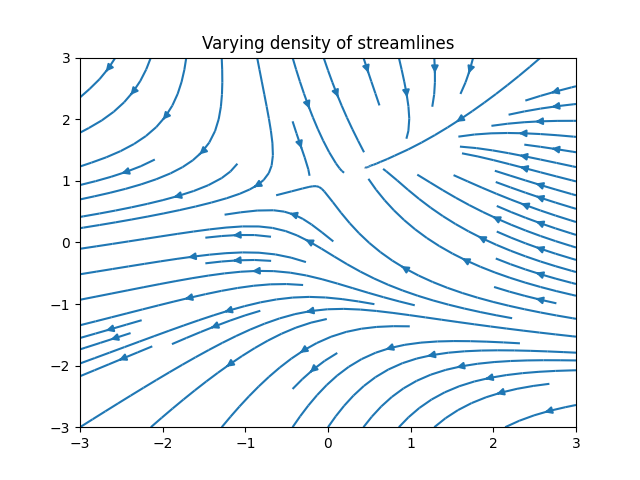
Example: varying density of streamlines
The density of streamlines can be controlled by using density parameter. Consider the example below:
import matplotlib.pyplot as plt
import numpy as np

# Creating data set
w = 3
Y, X = np.mgrid[-w:w:100j, -w:w:100j]
U = -1 - X**2 + Y
V = 1 + X - Y**2
speed = np.sqrt(U**2 + V**2)

fig, ax = plt.subplots()
ax.set_title("Varying density of streamlines")

#drawing stream plot
ax.streamplot(X, Y, U, V, density=[0.5, 1])

plt.show()
The output of the above code will be:
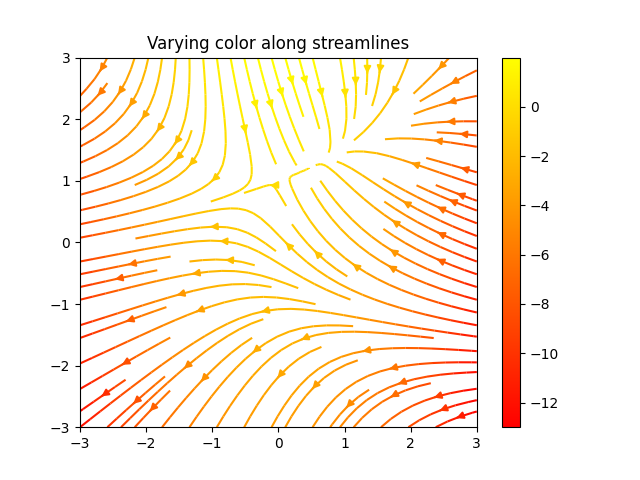
Example: varying color along streamlines
The varying color of streamlines can be achieved by using color and cmap parameters. Consider the example below:
import matplotlib.pyplot as plt
import numpy as np

# Creating data set
w = 3
Y, X = np.mgrid[-w:w:100j, -w:w:100j]
U = -1 - X**2 + Y
V = 1 + X - Y**2
speed = np.sqrt(U**2 + V**2)

fig, ax = plt.subplots()
ax.set_title("Varying color along streamlines")

#drawing stream plot
strm = ax.streamplot(X, Y, U, V, color = U, cmap ='autumn')
fig.colorbar(strm.lines)

plt.show()
The output of the above code will be: