Matplotlib - Triplot
A triplot involves creating a triangular grid. The matplotlib.pyplot.triplot() function draws a unstructured triangular grid as lines and/or markers.
The triangulation to plot can be specified in one of two ways. Either:
triplot(triangulation, ...)
where triangulation is a Triangulation object, or
triplot(x, y, ...)
triplot(x, y, triangles, ...)
triplot(x, y, triangles=triangles, ...)
triplot(x, y, mask=mask, ...)
triplot(x, y, triangles, mask=mask, ...)
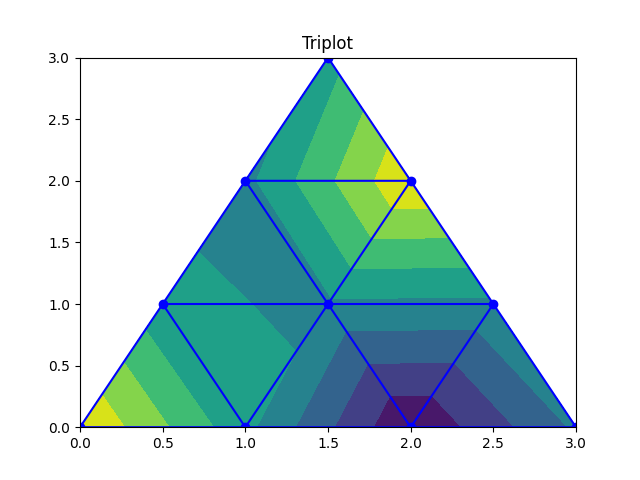
Example: triplot
The example below illustrates the matplotlib.pyplot.triplot() function of matplotlib.pyplot.
import matplotlib.pyplot as plt
import matplotlib.tri as mtri
import numpy as np

#creating triangulation.
x = np.asarray([0, 1, 2, 3, 0.5, 1.5,
                2.5, 1, 2, 1.5])
y = np.asarray([0, 0, 0, 0, 1.0, 1.0,
                1.0, 2, 2, 3.0])
triangles = [[0, 1, 4], [1, 2, 5], [2, 3, 6],
             [1, 5, 4], [2, 6, 5], [4, 5, 7],
             [5, 6, 8], [5, 8, 7], [7, 8, 9]]
triang = mtri.Triangulation(x, y, triangles)

#interpolating to regularly-spaced quad grid
z = np.cos(1.5 * x) * np.cos(1.5 * y)

#setting up the figure
fig, ax = plt.subplots()
ax.set_title('Triplot')

#plotting the triangulation
ax.tricontourf(triang, z)
ax.triplot(triang, 'bo-')

plt.show()
The output of the above code will be:
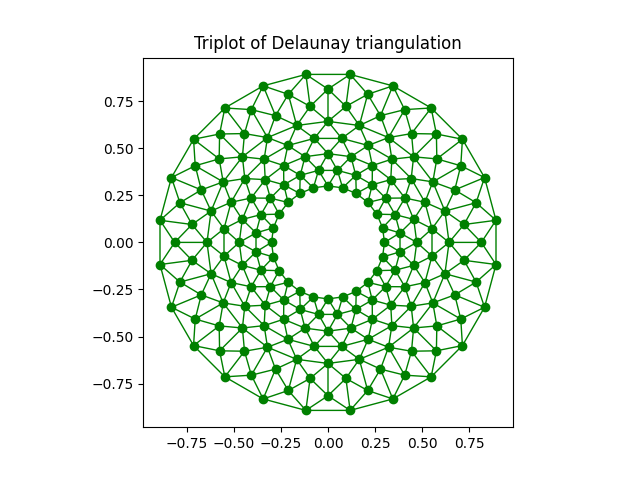
Example: triplot using delaunay triangulation
Lets consider another example to understand this function. Here, no triangles are created, only delaunay triangulation is created.
import matplotlib.pyplot as plt
import matplotlib.tri as tri
import numpy as np

#first creating the x and y coordinates of the points
n_angles = 24
n_radii = 8
min_radius = 0.3
radii = np.linspace(min_radius, 0.90, n_radii)

angles = np.linspace(0, 2 * np.pi, n_angles, endpoint=False)
angles = np.repeat(angles[..., np.newaxis], n_radii, axis=1)
angles[:, 1::2] += np.pi / n_angles

x = (radii * np.cos(angles)).flatten()
y = (radii * np.sin(angles)).flatten()

#creating the Triangulation -
#no triangles so Delaunay triangulation created
triang = tri.Triangulation(x, y)

#masking off the unwanted triangles
triang.set_mask(np.hypot(x[triang.triangles].mean(axis=1),
                         y[triang.triangles].mean(axis=1))
                < min_radius)

#setting up the figure
fig, ax = plt.subplots()
ax.set_title('Triplot of Delaunay triangulation')
ax.set_aspect('equal')

#plotting the triangulation
ax.triplot(triang, 'go-', lw=1)

plt.show()
The output of the above code will be: