Matplotlib - Box Plot
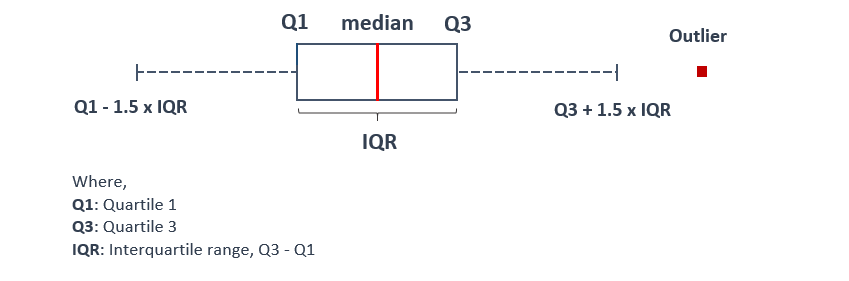
A box plot also known as a whisker plot is a method for graphically describing groups of numerical data through their quartiles. The box is drawn from first quartile (Q1) to third quartile (Q3) , indicating position of the median in the dataset. The whiskers extend from the box to show the range of the data.
The matplotlib.pyplot.boxplot() function makes a box and whisker plot for each column of x or each vector in sequence x.
Syntax
matplotlib.pyplot.boxplot(x, vert=None)
Parameters
x |
Required. Specify the input data as array or a sequence of vectors. |
vert |
Optional. If True (default), makes the boxes vertical. If False, makes horizontal boxes. |
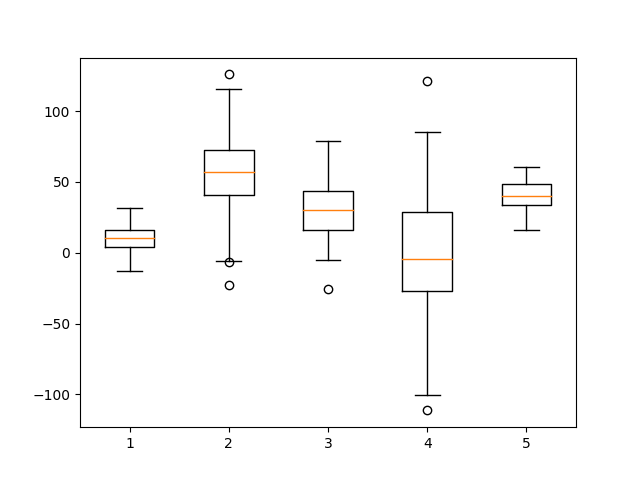
Example: box plot
In the example below, the five random normally distributed datasets are created using numpy. Each sample contains 100 records but different mean and standard deviation. Using these datasets, a box plot is drawn.
import matplotlib.pyplot as plt
import numpy as np

np.random.seed(1)

#creating dataset
data1 = np.random.normal(10, 10, 100)
data2 = np.random.normal(50, 30, 100)
data3 = np.random.normal(30, 20, 100)
data4 = np.random.normal(0, 40, 100)
data5 = np.random.normal(40, 10, 100)
data = [data1, data2, data3, data4, data5]

fig, ax = plt.subplots()

#drawing box plot
ax.boxplot(data)

plt.show()
The output of the above code will be:
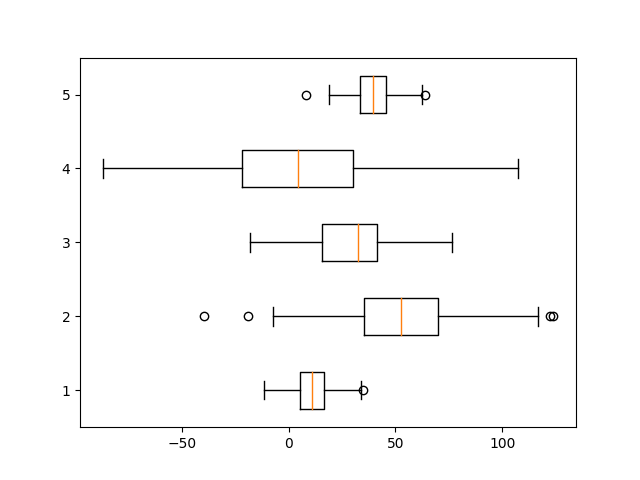
Example: horizontal box plot
By using vert parameter, a horizontal box plot can be created as shown in the example.
import matplotlib.pyplot as plt
import numpy as np

np.random.seed(1)

#creating dataset
data1 = np.random.normal(10, 10, 100)
data2 = np.random.normal(50, 30, 100)
data3 = np.random.normal(30, 20, 100)
data4 = np.random.normal(0, 40, 100)
data5 = np.random.normal(40, 10, 100)
data = [data1, data2, data3, data4, data5]

fig, ax = plt.subplots()

#drawing box plot
ax.boxplot(data, vert=False)

plt.show()
The output of the above code will be: