Matplotlib - 3D Quiver Plot
A three-dimensional axes can be created by passing projection='3d' keyword to the axes creation routine. After creating 3D axes, matplotlib.Axes3D.quiver() function is used to make quiver plot, where X, Y, Z define the arrow locations, U, V, W define the arrow directions.
Syntax
matplotlib.Axes3D.quiver(X, Y, Z, U, V, W,
                         length=1,
                         normalize=False)
Parameters
X, Y, Z |
Required. Specify x, y and z coordinates of the arrow locations. array-like. |
U, V, W |
Required. Specify x, y and z direction components of the arrow vectors. array-like. |
length |
Optional. Specify the length of each quiver. Default is 1. |
normalize |
Optional. Specify whether all arrows are normalized to have the same length, or keep the lengths defined by U, V, and W. Default is False. |
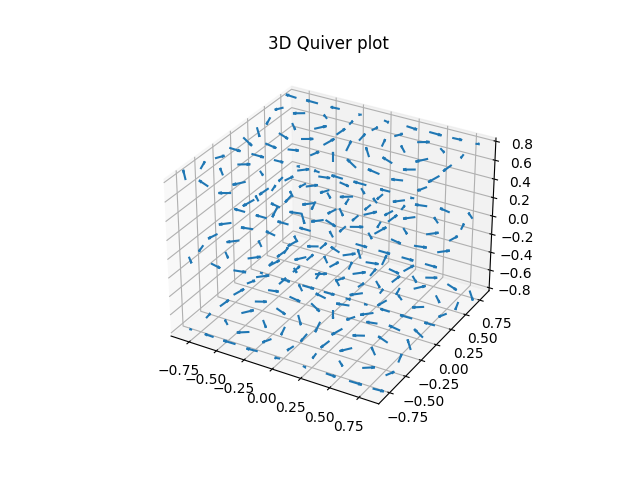
Example: 3D quiver plot
In the example below, the quiver() function is used to create a 3D quiver plot of a given dataset.
import matplotlib.pyplot as plt
import numpy as np

X, Y, Z = np.meshgrid(np.arange(-0.8, 1, 0.2),
                      np.arange(-0.8, 1, 0.2),
                      np.arange(-0.8, 1, 0.8))

U = np.sin(np.pi * X) * np.cos(np.pi * Y) * np.cos(np.pi * Z)
V = -np.cos(np.pi * X) * np.sin(np.pi * Y) * np.cos(np.pi * Z)
W = (np.sqrt(2.0 / 3.0) * np.cos(np.pi * X) * np.cos(np.pi * Y) *
     np.sin(np.pi * Z))

fig = plt.figure()
ax = fig.add_subplot(111, projection='3d')
ax.set_title("3D Quiver plot")

#drawing quiver plot
ax.quiver(X, Y, Z, U, V, W, length=0.1, normalize=True)

plt.show()
The output of the above code will be: