Matplotlib - Subplot2grid() Function
The Matplotlib.pyplot.subplot2grid() function provides additional flexibility to create axes object at a specified location inside a regular grid. It also allows the axes object to be spanned across multiple rows or columns.
Syntax
matplotlib.pyplot.subplot2grid(shape, loc,
                               rowspan=1, colspan=1)
Parameters
shape |
Required. Specify number of rows and of columns of the grid in which to place axis as (int, int). |
loc |
Required. Specify row number and column number of the axis location within the grid as (int, int). |
rowspan |
Optional. Specify number of rows for the axis to span downwards. Default is 1. |
colspan |
Optional. Specify number of columns for the axis to span to the right. Default is 1. |
Example: subplot2grid example
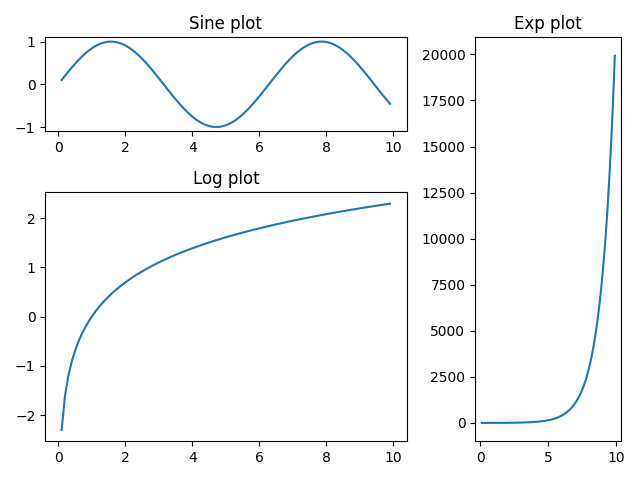
In the example below, a figure object of 3x3 grid is created and filled with axes objects of varying sizes in row and column spans, each showing a different plot.
import matplotlib.pyplot as plt
import numpy as np

#creating an array of values between
#0.1 to 10 with a difference of 0.1
x = np.arange(0.1, 10, 0.1)
y1 = np.sin(x)
y2 = np.exp(x)
y3 = np.log(x)

fig = plt.figure()
ax1 = plt.subplot2grid((3,3),(0,0),colspan = 2)
ax2 = plt.subplot2grid((3,3),(0,2), rowspan = 3)
ax3 = plt.subplot2grid((3,3),(1,0),rowspan = 2, colspan = 2)

#plotting curves
ax1.plot(x, y1)
ax2.plot(x, y2)
ax3.plot(x, y3)

#formatting axes
ax1.set_title("Sine plot")
ax2.set_title("Exp plot")
ax3.set_title("Log plot")

#displaying the figure
plt.tight_layout()
plt.show()
The output of the above code will be: