Matplotlib - Axis Limits & Scales
Axis Limits
Matplotlib automatically arrives at the minimum and maximum values of variables to be displayed along x, y (and z axis in case of 3D plot) axes of a plot. However, it is possible to set the limits explicitly by using Axes.set_xlim() and Axes.set_ylim() functions.
Syntax
#sets the x-axis view limits
Axes.set_xlim(self, left=None, right=None,
              auto=False, xmin=None, xmax=None)

#sets the y-axis view limits
Axes.set_ylim(self, bottom=None, top=None,
              auto=False, ymin=None, ymax=None)
Parameters
left, right |
Optional. The left and right xlim in data coordinates. Passing None leaves the respective limit unchanged. |
xmin, xmax |
Optional. Equivalent to left and right respectively, and it is an error to pass both xmin and left or xmax and right. |
bottom, top |
Optional. The bottom and top ylim in data coordinates. Passing None leaves the respective limit unchanged. |
ymin, ymax |
Optional. Equivalent to bottom and top respectively, and it is an error to pass both ymin and bottom or ymax and top. |
auto |
Optional. Specify whether to turn on autoscaling of the x-axis / y-axis. True turns on, False turns off (default action), None leaves unchanged. |
Example: setting axis limit
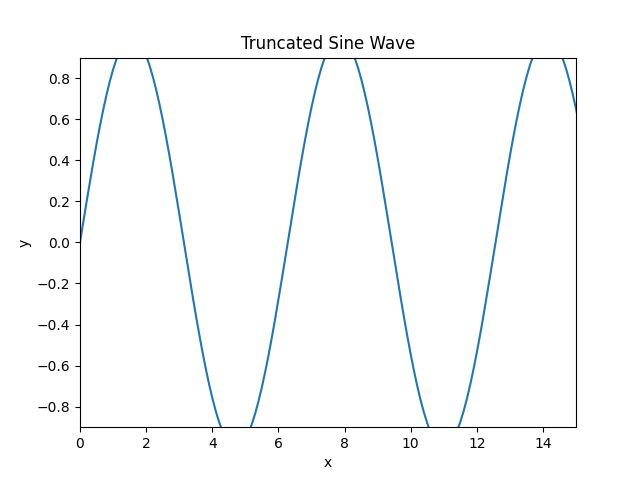
In the example below, although the x is defined from 0 to 20, the view limit is set to 0 to 15. Similarly, y has range -1 to 1, the view limit is set to -0.9 to 0.9.
import matplotlib.pyplot as plt
import numpy as np

#creating an array of values between
#0 to 20 with a difference of 0.1
x = np.arange(0, 20, 0.1)
y = np.sin(x)

fig, ax = plt.subplots()

#plotting curves
ax.plot(x, y)

#formatting axes
ax.set_title("Truncated Sine Wave")
ax.set_xlabel("x")
ax.set_ylabel("y")
ax.set_xlim(0,15)
ax.set_ylim(-0.9, 0.9)

#displaying the figure
plt.show()
The output of the above code will be:
Axis Scales
There are instances when a different scale of x-axis or y-axis is needed. In Matplotlib, it is possible to change the scale of the axis using Axes.set_xscale() and Axes.set_yscale() functions.
Syntax
#sets the x-axis scale
Axes.set_xscale(self, value, **kwargs)

#sets the y-axis scale
Axes.set_yscale(self, value, **kwargs)
Parameters
value |
Optional. Specify axis scale type to apply. It can be chosen from {'linear', 'log', 'symlog', 'logit', ...}. |
Example: setting axis scale
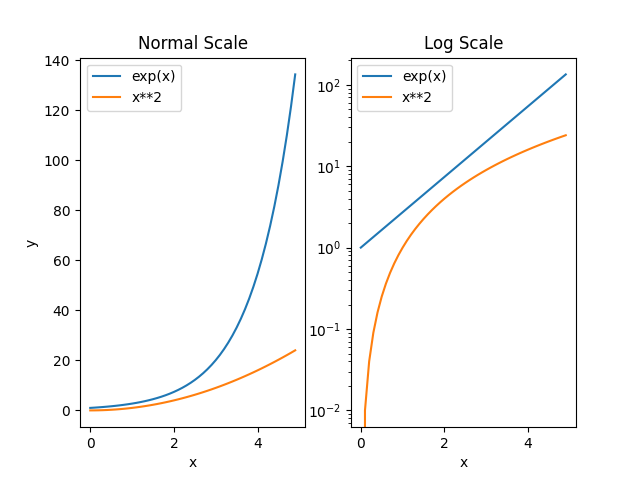
The example below demonstrates how to plot graphs in different scales.
import matplotlib.pyplot as plt
import numpy as np

#creating an array of values between
#0 to 5 with a difference of 0.1
x = np.arange(0, 5, 0.1)
y1 = np.exp(x)
y2 = x**2

fig, (ax1, ax2) = plt.subplots(1,2)

#first plot - normal scale
ax1.plot(x, y1)
ax1.plot(x, y2)
ax1.set_title("Normal Scale")
ax1.set_xlabel("x")
ax1.set_ylabel("y")
ax1.legend(['exp(x)', 'x**2'])

#second plot - log scale
ax2.set_yscale("log")
ax2.plot(x, y1)
ax2.plot(x, y2)
ax2.set_title("Log Scale")
ax2.set_xlabel("x")
ax2.legend(['exp(x)', 'x**2'])

#displaying the figure
plt.show()
The output of the above code will be: