Matplotlib - Subplots() Function
The Matplotlib.pyplot.subplots() function creates a figure and a grid of subplots with a single call, while providing reasonable control over how the individual plots are created. The syntax for using this function is given below:
Syntax
matplotlib.pyplot.subplots(nrows=1, ncols=1, **fig_kw)
Parameters
nrows |
Optional. Specify number of rows in the subplot grid. Default is 1. |
ncols |
Optional. Specify number of columns in the subplot grid. Default is 1. |
**fig_kw |
Optional. Additional keyword arguments are passed to the pyplot.figure call. |
Return Value
Returns fig:Figure and ax:axes or array of axes. Typical idioms for handling the return value are:
# using the variable ax for single Axes
fig, ax = plt.subplots()

# using the variable ax for multiple Axes
#axes can accessed using ax[0][0], ax[0][1],
#so on OR ax[0, 0], ax[0, 1]
fig, ax = plt.subplots(2, 2)

# using tuple unpacking for multiple Axes
#axes can accessed using ax1, ax2,.. etc
fig, (ax1, ax2) = plt.subplots(1, 2)
fig, ((ax1, ax2), (ax3, ax4)) = plt.subplots(2, 2)
Example: subplots example
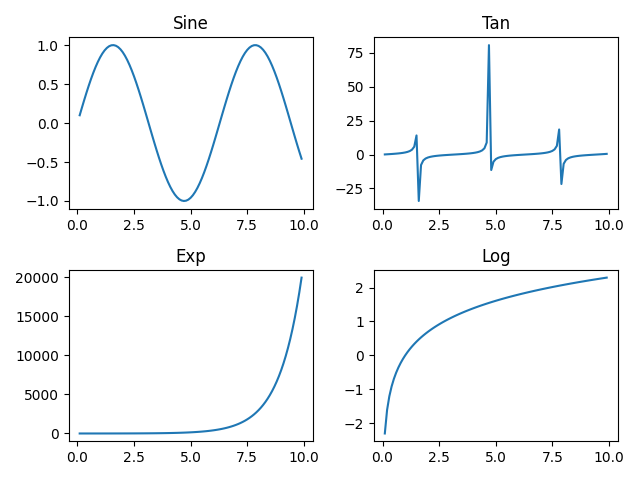
In the example below, a subplot of 2x2 grid is created each displaying a different plot.
import matplotlib.pyplot as plt
import numpy as np

#creating an array of values between
#0.1 to 10 with a difference of 0.1
x = np.arange(0.1, 10, 0.1)
y1 = np.sin(x)
y2 = np.tan(x)
y3 = np.exp(x)
y4 = np.log(x)

fig, ((ax1, ax2), (ax3, ax4)) = plt.subplots(2, 2)

#plotting curves
ax1.plot(x, y1)
ax2.plot(x, y2)
ax3.plot(x, y3)
ax4.plot(x, y4)

#formatting axes
ax1.set_title("Sine")
ax2.set_title("Tan")
ax3.set_title("Exp")
ax4.set_title("Log")

#displaying the figure
plt.tight_layout()
plt.show()
The output of the above code will be:
Super Title
The suptitle() function can be used to add title to the entire figure.
Example: adding title to a figure
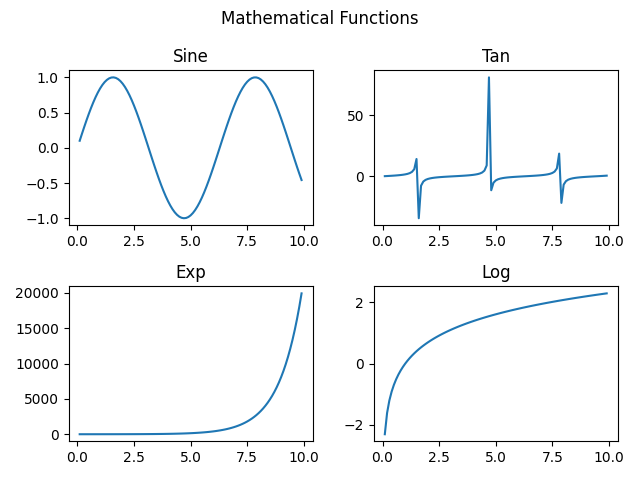
Consider the example below, where a super title is added to the above plot. Please also note the two different ways of handling the subplot() function return.
import matplotlib.pyplot as plt
import numpy as np

#creating an array of values between
#0.1 to 10 with a difference of 0.1
x = np.arange(0.1, 10, 0.1)
y1 = np.sin(x)
y2 = np.tan(x)
y3 = np.exp(x)
y4 = np.log(x)

fig, ax = plt.subplots(2, 2)

#plotting curves
#method 1
ax[0, 0].plot(x, y1)
ax[0, 1].plot(x, y2)
#method 2
ax[1][0].plot(x, y3)
ax[1][1].plot(x, y4)

#formatting axes
ax[0, 0].set_title("Sine")
ax[0, 1].set_title("Tan")
ax[1][0].set_title("Exp")
ax[1][1].set_title("Log")

#setting super title
plt.suptitle("Mathematical Functions")

#displaying the figure
plt.tight_layout()
plt.show()
The output of the above code will be: