Matplotlib - 3D Wireframe Plot
A three-dimensional axes can be created by passing projection='3d' keyword to the axes creation routine. After creating 3D axes, matplotlib.Axes3D.plot_wireframe() function is used to draw wireframe plot.
Syntax
matplotlib.Axes3D.plot_wireframe(X, Y, Z,
                                 rcount, ccount,
                                 rstride, cstride)
Parameters
X, Y, Z |
Required. Specify Data values. |
rcount, ccount |
Optional. Specify maximum number of samples used in each direction. If the input data is larger, it will be downsampled to these numbers of points. Setting a count to zero causes the data to be not sampled in the corresponding direction, producing a 3D line plot rather than a wireframe plot. Defaults to 50. |
rstride, cstride |
Optional. Specify downsampling stride in each direction. These arguments are mutually exclusive with rcount and ccount. If only one of rstride or cstride is set, the other defaults to 1. Setting a stride to zero causes the data to be not sampled in the corresponding direction, producing a 3D line plot rather than a wireframe plot. Default of rcount = ccount = 50. |
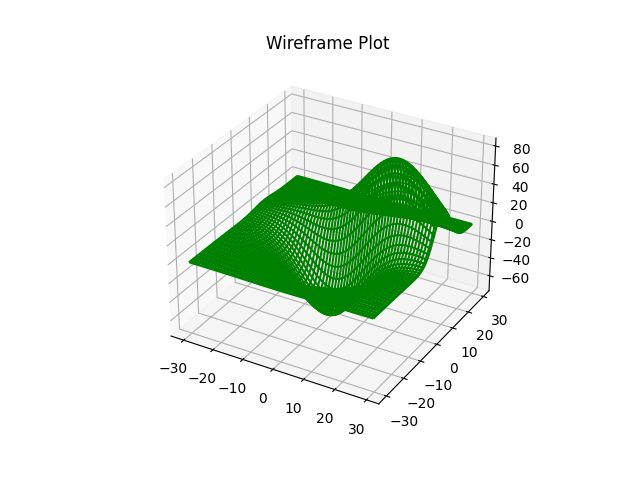
Example: 3D wireframe plot of test data
In the example below, wireframe plot is drawn for the test data present within the package.
import matplotlib.pyplot as plt
from mpl_toolkits.mplot3d import axes3d

fig = plt.figure()
ax = fig.add_subplot(111, projection='3d')
ax.set_title('Wireframe Plot')

#getting test data
X, Y, Z = axes3d.get_test_data(0.05)

#drawing wireframe plot
cb = ax.plot_wireframe(X, Y, Z, cstride=2,
                          rstride=2, color="green")

plt.show()
The output of the above code will be:
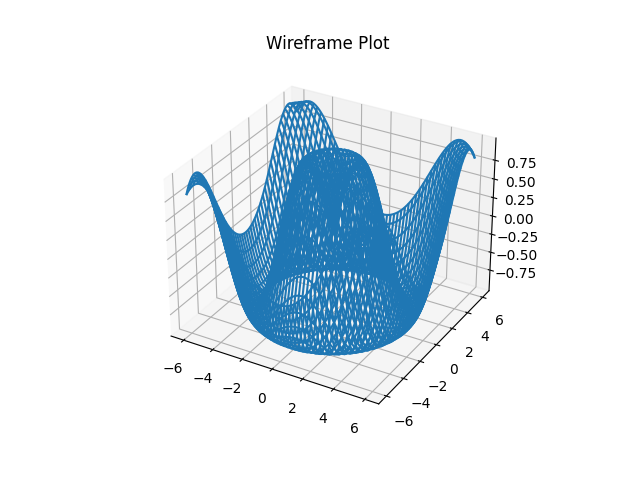
Example: 3D wireframe plot
Lets consider one more example. Here, the wireframe plot is drawn from user-defined 3D plane.
import matplotlib.pyplot as plt
import numpy as np

def f(x, y):
  return np.sin(np.sqrt(x ** 2 + y ** 2))

xlist = np.linspace(-6.0, 6.0, 100)
ylist = ylist = np.linspace(-6.0, 6.0, 100)
X, Y = np.meshgrid(xlist, ylist)

#creating 3D plane
Z = f(X, Y)

fig = plt.figure()
ax = fig.add_subplot(111, projection='3d')
ax.set_title('Wireframe Plot')

#drawing wireframe plot
cb = ax.plot_wireframe(X, Y, Z)

plt.show()
The output of the above code will be: