Matplotlib - Writing mathematical expressions
A subset TeX markup can be used in any matplotlib text string by placing it inside a pair of dollar signs ($). Please note that it does not require TeX to be installed, since Matplotlib ships its own TeX expression parser, layout engine, and fonts. The sample example is:
# math text
plt.title(r'$\alpha > \beta$')
This will produce "α > β".
Example: mathematical expression in plot
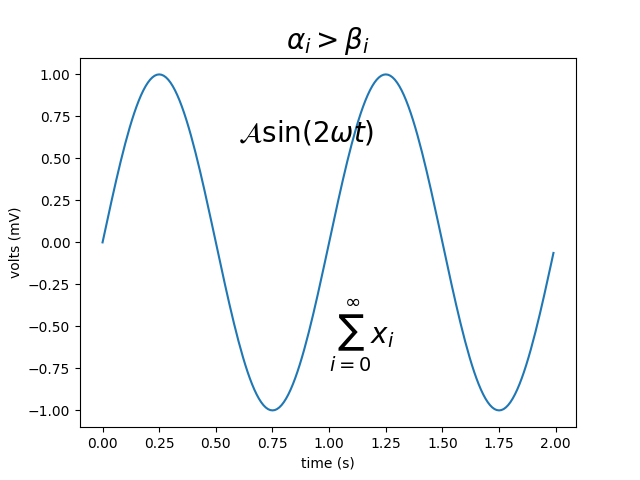
The example below describes how to put mathematical expression in a given plot.
import matplotlib.pyplot as plt
import numpy as np

t = np.arange(0.0, 2.0, 0.01)
s = np.sin(2*np.pi*t)

plt.plot(t, s)
plt.title(r'$\alpha_i > \beta_i$', fontsize=20)
plt.text(1, -0.6, r'$\sum_{i=0}^\infty x_i$', fontsize=20)
plt.text(0.6, 0.6, r'$\mathcal{A}\mathrm{sin}(2 \omega t)$',
         fontsize=20)
plt.xlabel('time (s)')
plt.ylabel('volts (mV)')
plt.show()
The output of the above code will be: