Matplotlib - Figure Class
Matplotlib contains a Figure class in the matplotlib.figure module. It is a top-level container for all plot elements. The Figure object is instantiated by calling the figure() function from the pyplot module. It is a state-based interface (pyplot module) in Matplotlib Library.
figure() Function
To create a new figure the figure() function of the pyplot module is used in the matplotlib library. The syntax for using this function is given below:
class matplotlib.figure.Figure(
                     figsize=None, dpi=None,
                     facecolor=None, edgecolor=None,
                     linewidth=0.0, frameon=None)
Parameters
figsize |
Optional. Specify figure dimension (width, height) in inches. Default is [6.4, 4.8]. |
dpi |
Optional. Specify dots per inch. Default is 100.0. |
facecolor |
Optional. Specify the figure patch facecolor. Default is 'white'. |
edgecolor |
Optional. Specify the figure patch edge color. Default is 'white'. |
linewidth |
Optional. Specify the linewidth of the frame. |
linewidth |
Optional. If False, suppress drawing the figure background patch. Default is True. |
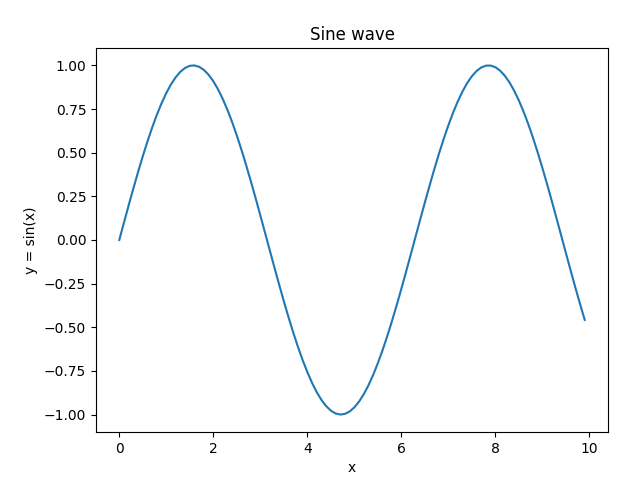
Example: simple plot
In the example below, figure() function is used create a figure object which is further used to draw a plot of y = sin(x).
import matplotlib.pyplot as plt
import numpy as np

#creating an array of values between
#0 to 10 with a difference of 0.1
x = np.arange(0, 10, 0.1)
y = np.sin(x)

#creating figure object
fig = plt.figure()
#creating axes object
ax = fig.add_axes([0.15,0.1,0.8,0.8])

#formatting axes
ax.set_title("Sine wave")
ax.set_xlabel("x")
ax.set_ylabel("y = sin(x)")

#drawing the plot
ax.plot(x, y)

#displaying the figure
plt.show()
The output of the above code will be:
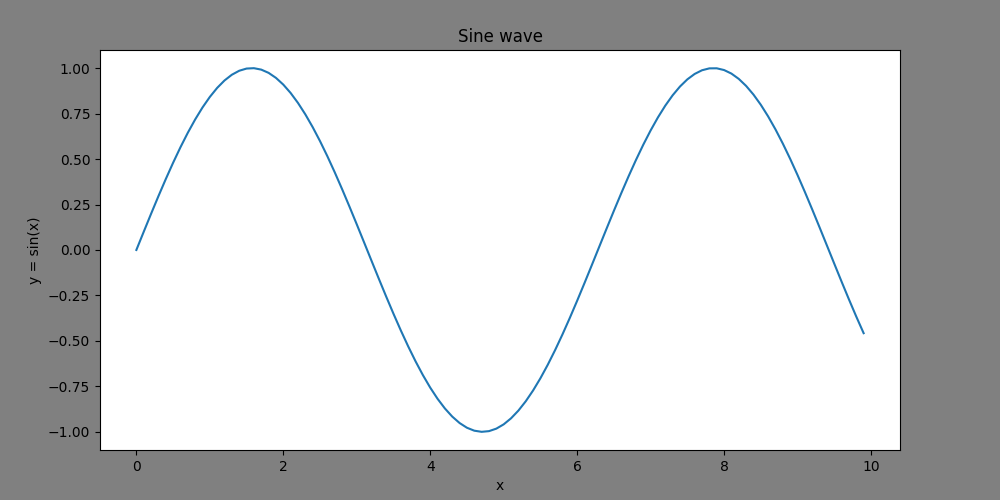
Example: customizing the figure object
Consider one more example where parameters of figure() function are used to customize the figure object.
import matplotlib.pyplot as plt
import numpy as np

#creating an array of values between
#0 to 10 with a difference of 0.1
x = np.arange(0, 10, 0.1)
y = np.sin(x)

#creating figure object
fig = plt.figure(figsize = [10, 5], facecolor = 'grey')
#creating axes object
ax = fig.add_axes([0.1,0.1,0.8,0.8])

#formatting axes
ax.set_title("Sine wave")
ax.set_xlabel("x")
ax.set_ylabel("y = sin(x)")

#drawing the plot
ax.plot(x, y)

#displaying the figure
plt.show()
The output of the above code will be: