Matplotlib - Formatting Axes
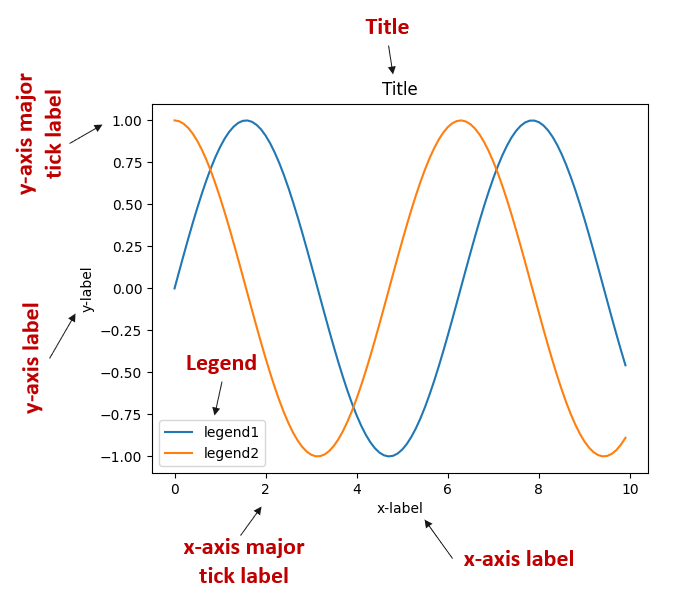
Axes object is the region of the image with the data space. It mainly contains two or three-axis(in case of 3D) objects which then take care of the data limits. Below is an image illustrating the different parts of a figure which contains the graph.
Let see how can we change different aspects of the Axes according to the requirements.
Axes Title & Labels
For setting title, the Axes.set_title() function is used. For setting x-axis and y-axis labels, Axes.set_xlabel() and Axes.set_ylabel() functions are used respectively.
Syntax
#sets a title for the Axes
Axes.set_title(self, loc='center')

#sets the label for the x-axis
Axes.set_xlabel(self, xlabel, labelpad=None,
                loc=None, **kwargs)

#sets the label for the y-axis
Axes.set_ylabel(self, ylabel, labelpad=None,
                loc=None, **kwargs)
Parameters
xlabel, ylabel |
Required. Specify label text. |
labelpad |
Optional. Specify float. Spacing in points from the axes bounding box including ticks and tick labels. Default: 4.0 |
loc |
Optional. Specify the label position. It can take value from {'left', 'center', 'right'}. |
Example: formatting axes
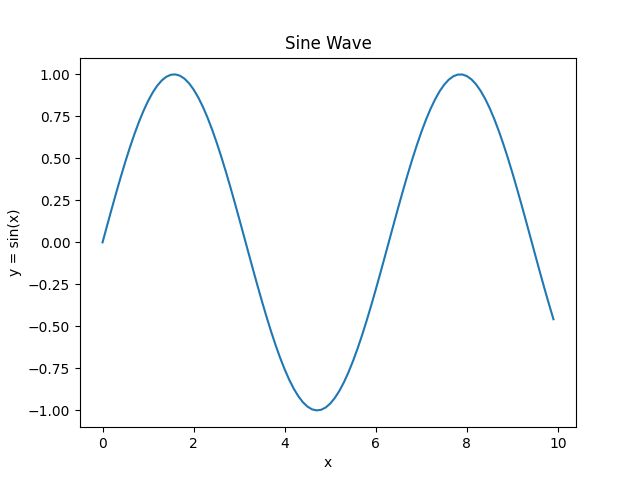
In the example below, the axes labels and title are set.
import matplotlib.pyplot as plt
import numpy as np

#creating an array of values between
#0 to 10 with a difference of 0.1
x = np.arange(0, 10, 0.1)
y = np.sin(x)

fig, ax = plt.subplots()

#plotting curves
ax.plot(x, y)

#formatting axes
ax.set_title("Sine Wave")
ax.set_xlabel("x")
ax.set_ylabel("y = sin(x)")

#displaying the figure
plt.show()
The output of the above code will be:
Axes Legend
For setting legend, the Axes.legend() function is used.
Syntax
#sets a title for the Axes
Axes.legend(self, *args, **kwargs)
The call signatures are:
#Automatic detection of elements for legend
legend()

#Labeling existing plot elements
legend(labels)

#Explicitly defining the elements for legend
legend(handles, labels)
Along with this, the location of the legend can be specified using loc parameter. It can take value from the table below:
| Location String | Location Code |
|---|---|
| 'best' | 0 |
| 'upper right' | 1 |
| 'upper left' | 2 |
| 'lower left' | 3 |
| 'lower right' | 4 |
| 'right' | 5 |
| 'center left' | 6 |
| 'center right' | 7 |
| 'lower center' | 8 |
| 'upper center' | 9 |
| 'center' | 10 |
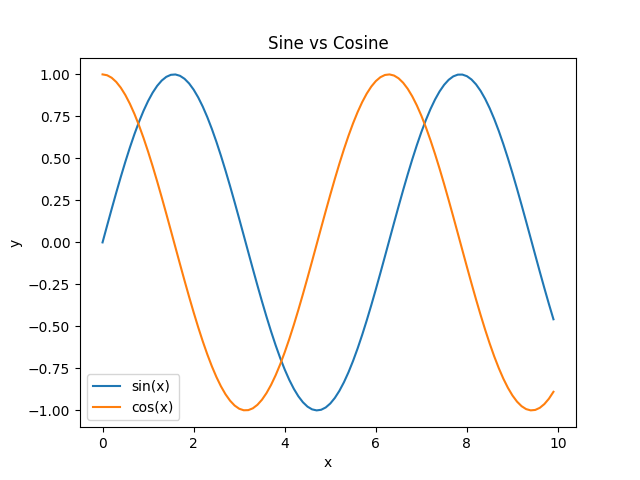
Example: adding legends
In the example below, the axes legend is set using legend(labels) calling signature.
import matplotlib.pyplot as plt
import numpy as np

#creating an array of values between
#0 to 10 with a difference of 0.1
x = np.arange(0, 10, 0.1)
y1 = np.sin(x)
y2 = np.cos(x)

fig, ax = plt.subplots()

#plotting curves
ax.plot(x, y1)
ax.plot(x, y2)

#formatting axes
ax.set_xlabel("x")
ax.set_ylabel("y")
ax.set_title("Sine vs Cosine")

#adding legend
ax.legend(['sin(x)', 'cos(x)'], loc=0)

#displaying the figure
plt.show()
The output of the above code will be: