Matplotlib - Twin Axes
Matplotlib supports dual x or y axes in a figure using twinx() and twiny() functions. The Axes.twinx() function creates dual y-axes and sharing the x-axis whereas Axes.twiny() function creates dual x-axes and sharing the y-axis.
Syntax
#creates dual x-axes
Axes.twinx()

#creates dual y-axes
Axes.twiny()
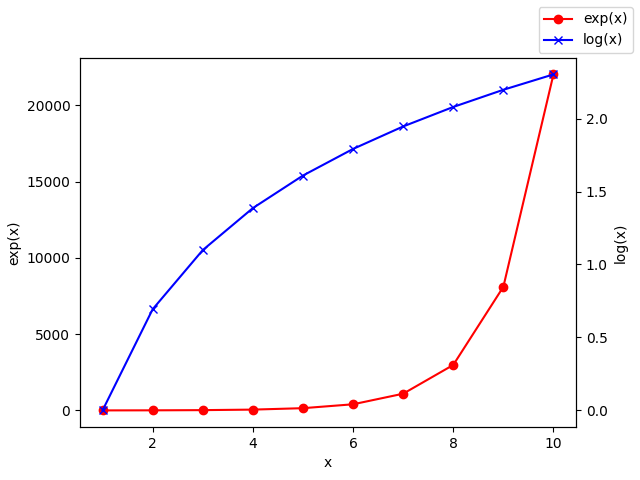
Example: dual y-axes
In the following example, the plot has dual y-axes one showing graph of exp(x) and the other showing graph of log(x).
import matplotlib.pyplot as plt
import numpy as np

fig = plt.figure()
ax1 = fig.add_subplot(111)
ax2 = ax1.twinx()

x = np.arange(1, 11)

#plotting curves
ax1.plot(x, np.exp(x), 'ro-')
ax2.plot(x, np.log(x), 'bx-')

#formatting axes
ax1.set_xlabel('x')
ax1.set_ylabel('exp(x)')
ax2.set_ylabel('log(x)')
fig.legend(labels = ('exp(x)','log(x)'))

plt.show()
The output of the above code will be:
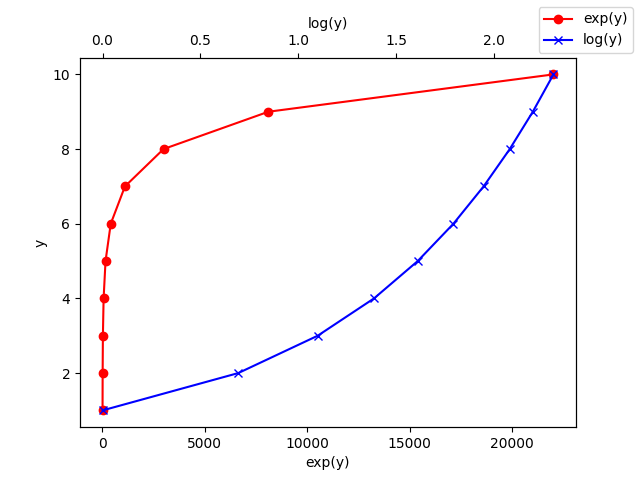
Example: dual x-axes
The dual x-axes can be created using twiny() function. Please consider the example below.
import matplotlib.pyplot as plt
import numpy as np

fig = plt.figure()
ax1 = fig.add_subplot(111)
ax2 = ax1.twiny()

y = np.arange(1, 11)

#plotting curves
ax1.plot(np.exp(y), y, 'ro-')
ax2.plot(np.log(y), y, 'bx-')

#formatting axes
ax1.set_ylabel('y')
ax1.set_xlabel('exp(y)')
ax2.set_xlabel('log(y)')
fig.legend(labels = ('exp(y)','log(y)'))

plt.show()
The output of the above code will be: