Matplotlib - Multiplots
The Matplotlib.pyplot.subplot() function adds an Axes to the current figure or retrieve an existing Axes. This is a wrapper of Figure.add_subplot() which provides additional behavior when working with the implicit API. The syntax for using this function is given below:
Syntax
matplotlib.pyplot.subplot(nrows, ncols, index, **kwargs)
Parameters
nrows, ncols, index |
Specify the position of the subplot described by:
|
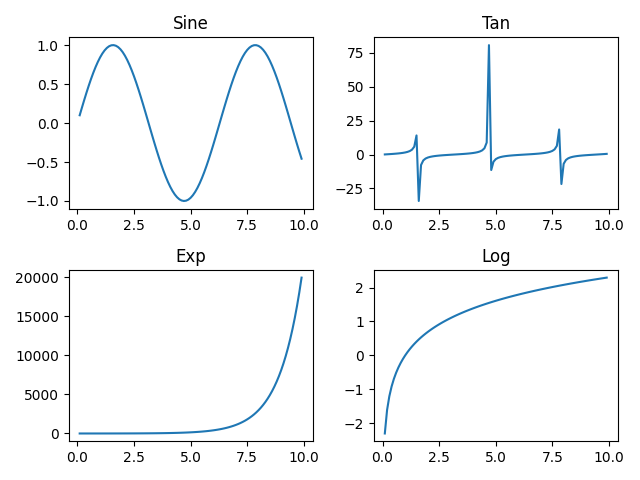
Example: subplot example
In the example below, a multiplot with four plot is created using nrows=2 and cols=2. In this 2x2 grid, each plot is displaying a different graph.
import matplotlib.pyplot as plt
import numpy as np

#creating an array of values between
#0.1 to 10 with a difference of 0.1
x = np.arange(0.1, 10, 0.1)

#first plot
plt.subplot(2,2,1)
plt.plot(x, np.sin(x))
plt.title("Sine")

#second plot
plt.subplot(2,2,2)
plt.plot(x, np.tan(x))
plt.title("Tan")

#third plot
plt.subplot(2,2,3)
plt.plot(x, np.exp(x))
plt.title("Exp")

#fourth plot
plt.subplot(2,2,4)
plt.plot(x, np.log(x))
plt.title("Log")

#displaying the figure
plt.tight_layout()
plt.show()
The output of the above code will be:
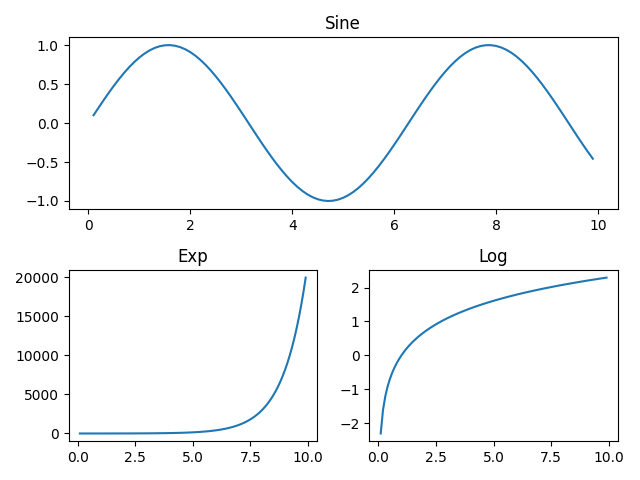
Example: two-tuple index
The index can be a two-tuple specifying the (first, last) indices. Like subplot(2, 2, (1, 2)) used here, makes the subplot spanning the upper half of the figure.
import matplotlib.pyplot as plt
import numpy as np

#creating an array of values between
#0.1 to 10 with a difference of 0.1
x = np.arange(0.1, 10, 0.1)

#first plot
plt.subplot(2,2,(1,2))
plt.plot(x, np.sin(x))
plt.title("Sine")

#second plot
plt.subplot(2,2,3)
plt.plot(x, np.exp(x))
plt.title("Exp")

#third plot
plt.subplot(224)
plt.plot(x, np.log(x))
plt.title("Log")

#displaying the figure
plt.tight_layout()
plt.show()
The output of the above code will be:
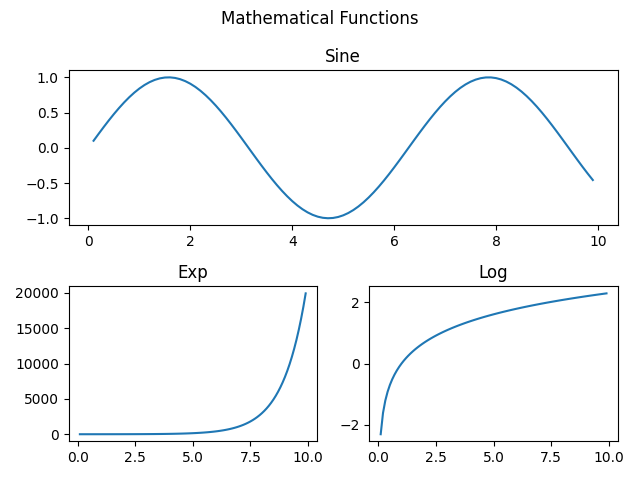
Super Title
The suptitle() function can be used to add title to the entire figure.
Example: adding title to a figure
Consider the example below, where a super title is added to the above plot.
import matplotlib.pyplot as plt
import numpy as np

#creating an array of values between
#0.1 to 10 with a difference of 0.1
x = np.arange(0.1, 10, 0.1)

#first plot
plt.subplot(2,2,(1,2))
plt.plot(x, np.sin(x))
plt.title("Sine")

#second plot
plt.subplot(2,2,3)
plt.plot(x, np.exp(x))
plt.title("Exp")

#third plot
plt.subplot(224)
plt.plot(x, np.log(x))
plt.title("Log")

#setting super title
plt.suptitle("Mathematical Functions")

#displaying the figure
plt.tight_layout()
plt.show()
The output of the above code will be:
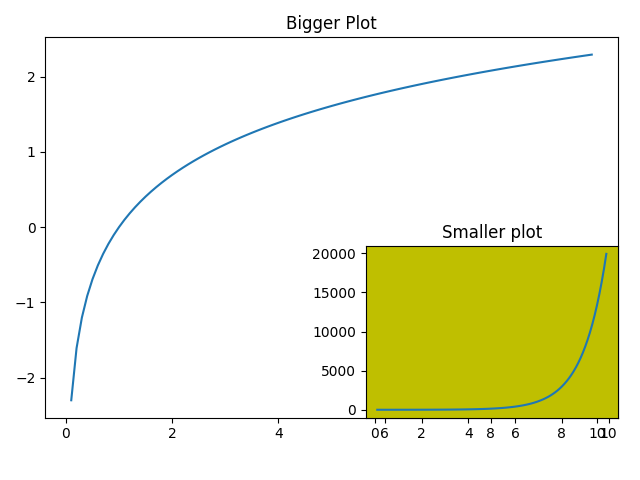
Overlapping plots
The add_subplot() function of the figure class can be used to create a overlapping plot. The function do not overwrite the existing plot.
Example: overlapping plot
Consider the example below, where add_subplot() function is used to create a overlapping plot.
import matplotlib.pyplot as plt
import numpy as np

#creating an array of values between
#0.1 to 10 with a difference of 0.1
x = np.arange(0.1, 10, 0.1)

#bigger plot
fig = plt.figure()
plt.plot(x, np.log(x))
plt.title("Bigger Plot")

#smaller plot
fig.add_subplot(2,2,4, facecolor='y')
plt.plot(x, np.exp(x))
plt.title("Smaller plot")

#displaying the figure
plt.tight_layout()
plt.show()
The output of the above code will be: