Matplotlib - Text in Plots
Matplotlib has extensive text support, including support for mathematical expressions, truetype support for raster and vector outputs, newline separated text with arbitrary rotations, and unicode support.
It embeds fonts directly in output documents. FreeType support produces very nice, antialiased fonts, that look good even at small raster sizes. Matplotlib includes its own matplotlib.font_manager, which implements a cross platform, W3C compliant font finding algorithm.
The user has a great deal of control over text properties (font size, font weight, text location and color, etc.).
| pyplot API | Object-oriented API | Description |
|---|---|---|
| text | text | Add text at an arbitrary location of the Axes. |
| annotate | annotate | Add an annotation, with an optional arrow, at an arbitrary location of the Axes. |
| xlabel | set_xlabel | Add a label to the Axes's x-axis. |
| ylabel | set_ylabel | Add a label to the Axes's y-axis. |
| title | set_title | Add a title to the Axes. |
| figtext | text | Add text at an arbitrary location of the Figure. |
| suptitle | suptitle | Add a title to the Figure. |
All of these functions create and return a Text instance, which can be configured with a variety of font and other properties.
Example: text in plot
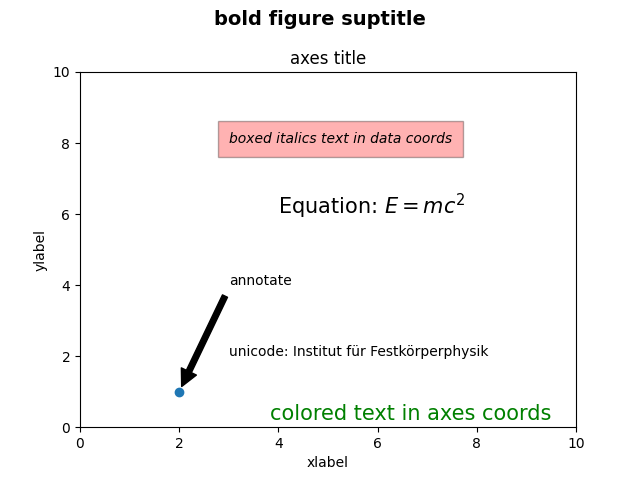
The example below shows all of these commands in action.
import matplotlib.pyplot as plt

fig, ax = plt.subplots()
fig.subplots_adjust(top=0.85)

#setting titles for the figure and the subplot respectively
fig.suptitle('bold figure suptitle', fontsize=14, fontweight='bold')
ax.set_title('axes title')

ax.set_xlabel('xlabel')
ax.set_ylabel('ylabel')

#setting x-axis and y-axis limits to [0, 10] instead of default [0, 1]
ax.axis([0, 10, 0, 10])

ax.text(3, 8, 'boxed italics text in data coords', style='italic',
        bbox={'facecolor': 'red', 'alpha': 0.3, 'pad': 8})

ax.text(4, 6, r'Equation: $E=mc^2$', fontsize=15)

ax.text(3, 2, 'unicode: Institut für Festkörperphysik')

ax.text(0.95, 0.01, 'colored text in axes coords',
        verticalalignment='bottom', horizontalalignment='right',
        transform=ax.transAxes,
        color='green', fontsize=15)

ax.plot([2], [1], 'o')
ax.annotate('annotate', xy=(2, 1), xytext=(3, 4),
            arrowprops=dict(facecolor='black', shrink=0.05))

plt.show()
The output of the above code will be: