Matplotlib - Quiver Plot
Quiver plot is basically a type of 2D plot which shows vector lines as arrows. Quiver(X,Y,U,V) plots arrows with directional components U and V at the Cartesian coordinates specified by X and Y. For example, the first arrow originates from the point X(1) and Y(1), extends horizontally according to U(1), and extends vertically according to V(1).
The matplotlib.pyplot.quiver() function is used to make quiver plot, where X, Y define the arrow locations, U, V define the arrow directions, and C optionally sets the color.
Syntax
matplotlib.pyplot.quiver([X, Y], U, V, [C])
Parameters
X, Y |
Optional. Specify x and y coordinates of the arrow locations. 1D or 2D array-like. If not given, they will be generated as a uniform integer meshgrid based on the dimensions of U and V.
|
U, V |
Required. Specify x and y direction components of the arrow vectors. 1D or 2D array-like. |
C |
Optional. Specify numeric data that defines the arrow colors. 1D or 2D array-like. |
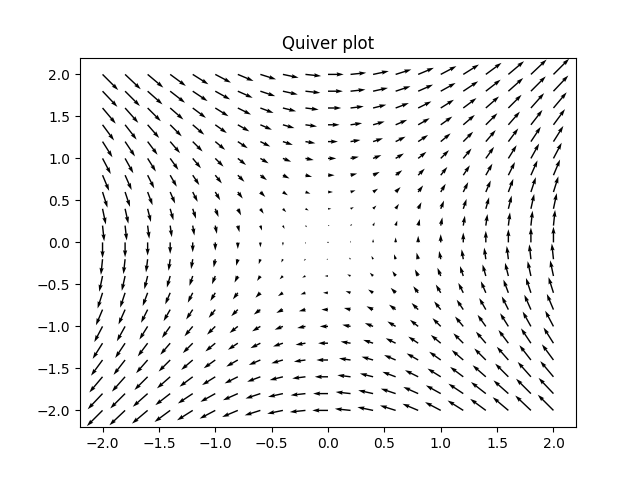
Example: quiver plot
In the example below, the quiver() function is used to create a quiver plot of a given dataset.
import matplotlib.pyplot as plt
import numpy as np

x = np.arange(-2, 2.2, 0.2)
y = np.arange(-2, 2.2, 0.2)

X, Y = np.meshgrid(x, y)
z = X**2+Y**2
U, V = np.gradient(z)

fig, ax = plt.subplots()
ax.set_title("Quiver plot")

#drawing quiver plot
ax.quiver(X, Y, U, V)

plt.show()
The output of the above code will be:
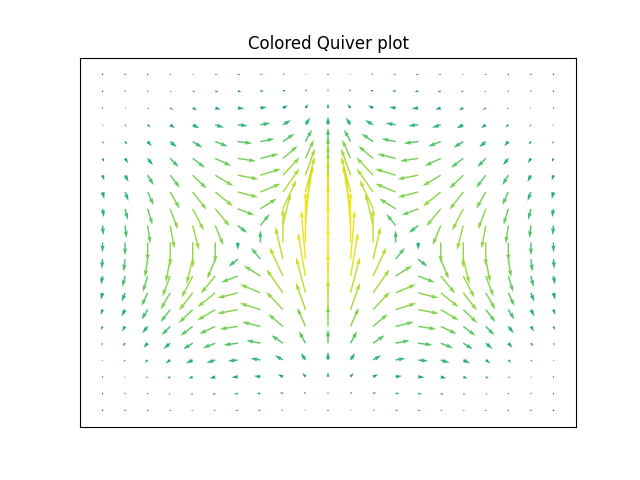
Example: coloring quiver plot
The ax.quiver() method provides an optional attribute color that can be used to specify the color of the arrow. This attribute requires the dimensions same as the position and direction arrays. Consider the example below where this attribute is used to color the given quiver plot.
import matplotlib.pyplot as plt
import numpy as np

x = np.arange(-2, 2.2, 0.2)
y = np.arange(-2, 2.2, 0.2)

X, Y = np.meshgrid(x, y)
z = X * np.exp(-X**2 -Y**2)
U, V = np.gradient(z)

# Defining color
color = np.log(U**2 + V**2)

fig, ax = plt.subplots()
ax.set_title("Colored Quiver plot")

#removing ticks from x and y axis
ax.xaxis.set_ticks([])
ax.yaxis.set_ticks([])
#making equal aspect ratio
ax.set_aspect('equal')

#drawing quiver plot
ax.quiver(X, Y, U, V, color)

plt.show()
The output of the above code will be: